I am not even sure what to say about this week’s price action. It is absolutely horrible. XRP price is around $1.00 for days, not moving in either direction really. I am starting to think this is a stablecoin.
Jokes aside, the community is worried, and we are seeing the first on-chain signs of this. XRP has been trading in an extremely tight range, and the lack of volatility is testing the patience of even the most committed holders.
What you'll learn 👉
Santiment: Bearish Sentiment Hits 3-Month Extreme
Santiment data shows that negativity around XRP surged throughout this week as prices failed to rally. Crowd commentary is now at a 3-month bearish extreme across X, Reddit, Telegram, and other crypto channels. The tallest red sentiment bar on the chart sits at the far right, coinciding with XRP breaking below $1.00.
The XRP Ledger, on the other hand, is not so quiet. XRP just had 49,929 active addresses in a single 24-hour span – its highest activity level in over two months. Earlier July activity had dropped near 2026 lows, so this spike is a real step-change.
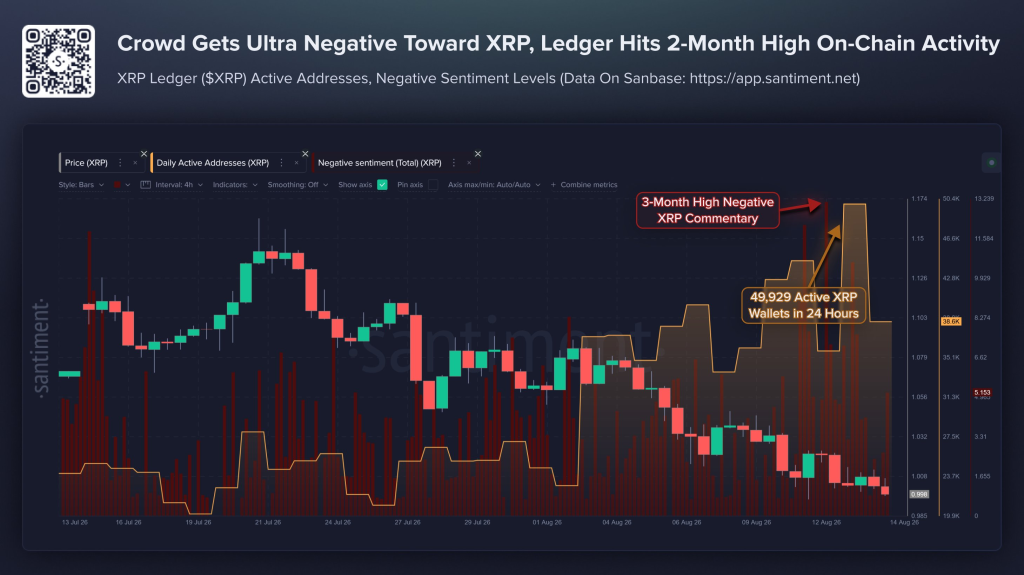
Where to add nuance: Rising active addresses is not unambiguously bullish. More on-chain activity can mean accumulation, but it can just as easily reflect capitulation selling, exchange inflows ahead of further selling, or panic movement of funds. The chart does not distinguish between “wallets buying the dip” and “wallets fleeing to exchanges to sell.”
Extreme negative sentiment as a contrarian indicator is a real, historically observed pattern in crypto, but it is a probabilistic tendency, not a reliable timing signal. Sentiment can stay “extreme” for extended periods during genuine downtrends, especially when there is a fundamental catalyst – which there is here. This ties directly to the CLARITY Act stalling and the sub-$1 price action we have covered in earlier articles.
More Crypto Online: A Larger Bearish Structure
The daily chart from More Crypto Online reveals a much longer history, going back to roughly February 2025. It shows the larger wave count MCO Global is working within:
- Wave (V) topping near $3.40 – the final wave of an even larger prior structure
- Wave A down to roughly $1.75 , followed by a wave 2 bounce back near the highs (~$3.30)
- Wave 1 down , wave 2 corrective bounce (topping around $1.30–1.42), wave 3 down to roughly $1.05
- Wave 4 bounce back to roughly $1.40
- Wave (4) now completing , price currently sitting at $1.00 , right at the edge of the orange zone where wave (5) is projected to unfold
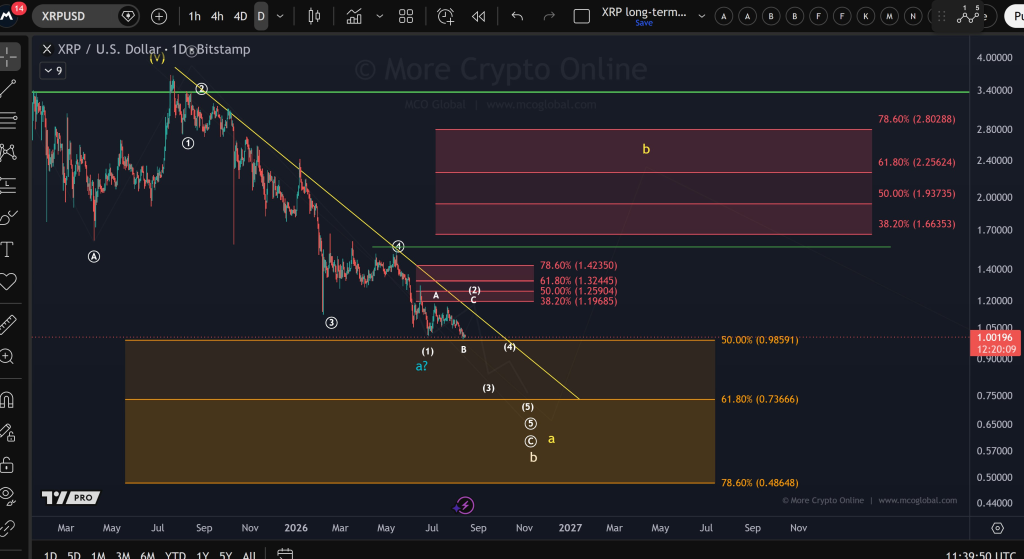
Wave (5) target: The chart projects a further decline through $0.75 , with sub-wave labels extending the target zone down to the 50.00%–78.60% Fibonacci retracement band, roughly $0.49–$0.74.
This is consistent with the more bearish MCO Global count from the 4‑hour chart. The $0.68–$0.72 wave (5) target we saw earlier lines up with the top of this daily chart’s projected zone, but the daily version shows the full extension down toward $0.49 as a deeper possibility within the same wave 5 structure.
The “Same Price” Observation
The tweet that sparked the discussion said: “Two years of headlines, same price… what is the chart seeing that the news is not?”
A few things worth separating here:
The “same price” observation is factually reasonable. XRP was trading in a broadly similar $1–$3 range across 2025–2026, and it is now testing $1.00 again. The observation that price has round-tripped over roughly two years is a fair read of the chart.
But “what is the chart seeing that the news isn’t” is rhetorical framing that implies technical analysis has some kind of independent predictive insight beyond fundamentals and news. This is a common narrative device in TA‑focused content, but it is worth being skeptical of the premise itself. Charts do not “see” anything independently. They reflect the same collective buying and selling that news and fundamentals also drive.
A wave count is not an alternate data source to news – it is a pattern‑fitting exercise on the same price data that is also shaped by the news (CLARITY Act delays, sentiment, etc.).
Read also: We Asked AI What XRP Could Be Worth If Bitcoin Hits $500K Next Bull Run
The Convergence Across Methods
At this point, XRP is being analyzed through several independent lenses that all currently point the same direction – further downside likely, at least in the near term:
| Lens | Signal |
|---|---|
| Polymarket | 67% odds of sub‑$1 by Sept 1 |
| CasiTrades 4‑hour count | Wave 3 target ~$0.94, wave 5 target ~$0.85–0.87 |
| MCO Global daily count | Wave 5 target ~$0.49–0.74 |
| Santiment sentiment | Extreme bearish sentiment, rising active addresses |
| Fundamental backdrop | CLARITY Act stalled until at least Sept 14 |
The convergence across methods is worth noting as directionally informative. Multiple independent approaches lean bearish or neutral‑bearish in the near term. But the specific price targets diverge wildly – from $0.49 to $0.94 – which is a reminder that “multiple bearish signals” does not mean “precise agreement on where it stops.”
All in all, the XRP price action is ugly. The token is stuck near $1.00, and the bearish signals are piling up. Polymarket, Elliott Wave counts, and sentiment data all point to further downside.
Subscribe to our YouTube channel for daily crypto updates, market insights, and expert analysis.