
Optimism has returned to parts of the crypto market, although prices have not fully confirmed that confidence. That disconnect is exactly what deserves attention today. XRP and Ethereum have attracted far more bullish commentary over the past few days, even though both assets continue to trade around key technical levels.
That combination does not always produce the outcome many expect. History has shown that when excitement grows faster than price strength, markets can pause or even move lower before the next major advance begins. Fresh sentiment data from Santiment Intelligence points toward that possibility, and current chart analysis for both XRP and Ethereum paints a similar picture.
What you'll learn 👉
Santiment Data Shows XRP and Ethereum Sentiment Has Become Overly Bullish
Santiment Intelligence reported that XRP and Ethereum now carry the strongest fear of missing out across the largest cryptocurrencies.
The firm’s Positive vs. Negative Commentary Ratio reached a 5 week high. XRP recorded 3.02 bullish comments for every 1 bearish comment, making it the most optimistic large cap crypto asset. Ethereum followed with a ratio of 2.31, which places it in mild fear of missing out territory. Bitcoin looked far more balanced with a ratio of 1.40.
✍️ TL;DR: 5-week high FOMO appears for XRP and Ethereum
— Santiment Intelligence (@SantimentData) July 13, 2026
📊 Metrics Used: Positive vs. Negative Commentary Ratio
🔗 Live Chart: https://t.co/icmgnCJiFT
📊 Sentiment is no longer fearful across the big three, but it’s also not evenly balanced. On Monday, $XRP is showing the most… pic.twitter.com/3SgH7R1MUG
Santiment noted that crypto markets often move against the majority view during periods of extreme optimism. Bullish sentiment can sometimes limit upside if prices fail to keep pace with expectations. That creates the possibility of a short term pullback or a slower recovery before buyers regain control.
Bitcoin’s more balanced sentiment could leave more room for upside if demand continues to improve because expectations remain less crowded.
XRP Price Recovery Faces Strong Resistance From Bearish Indicators
XRP price has started to recover from recent weakness, although the technical picture still needs more confirmation before a stronger rally becomes likely.
Current analysis shows XRP trading near $1.06. A move above $1.080 would strengthen the bullish case and could encourage additional buying pressure.
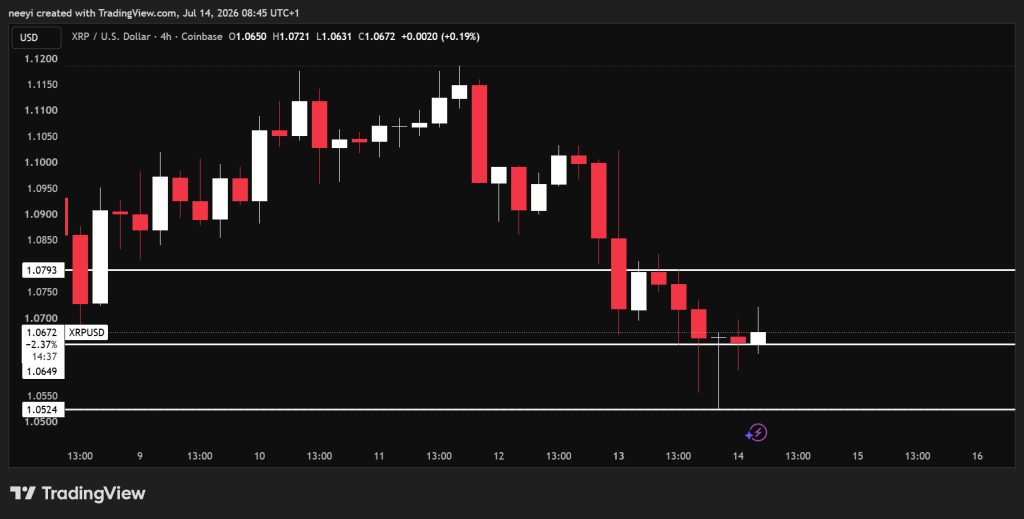
Current indicators, however, have not fully turned positive. A look at the 5 hour chart from Investing.com shows the bearish outlook still carries more weight. That means XRP could struggle unless buyers reclaim key resistance levels.
Each of the major indicators points to the following outlook:
- RSI (14): The reading stands at 38.497. That remains below the neutral zone and produces a sell signal because buying strength remains limited.
- Stochastic (9,6): The indicator reads 27.611. Momentum continues to favor sellers even though the market is nearing oversold territory.
- MACD (12,26): The value stands at -0.013. This indicator still generates a sell signal because bullish momentum has not fully returned.
- ADX (14): The reading sits at 42.05. That indicates the current trend remains strong. Current direction still favors the bearish outlook.
| Indicator | Value | Action |
|---|---|---|
| RSI (14) | 38.497 | Sell |
| STOCH (9,6) | 27.611 | Sell |
| MACD (12,26) | -0.013 | Sell |
| ADX (14) | 42.05 | Sell |
Ethereum Price Still Needs More Confirmation Before Buyers Take Control
Ethereum shows a similar technical setup despite stronger market optimism.
Ethereum price could turn more bullish if buyers push above $1,788. Such a move could open the door for a test of prices above $1,800 during today’s session.
Current downside risk has not disappeared. A break below $1,772 would strengthen the bearish case and could send Ethereum lower before another recovery attempt develops.
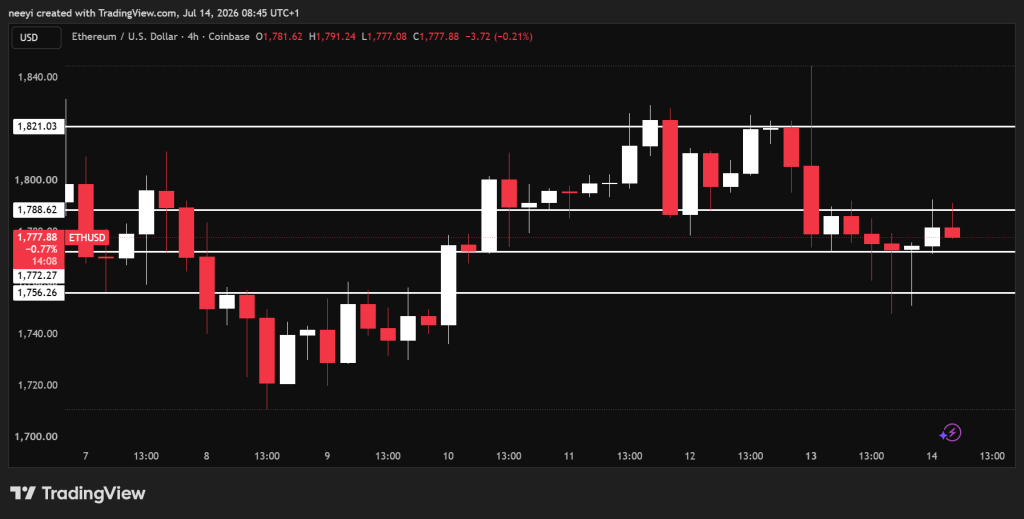
The 5 hour technical indicators from Investing.com still lean toward caution despite a couple of improving signals.
The indicators currently show the following:
- RSI (14): The reading is 50.408. Momentum remains neutral because buying and selling pressure are closely balanced.
- Stochastic (9,6): The indicator stands at 26.917. This continues to generate a sell signal because short term momentum remains weak.
- MACD (12,26): The value is 0.3. This produces a buy signal after momentum turned slightly positive.
- ADX (14): The reading reaches 39.961. Trend strength remains firm and currently supports the existing market direction.
| Indicator | Value | Action |
|---|---|---|
| RSI (14) | 50.408 | Neutral |
| STOCH (9,6) | 26.917 | Sell |
| MACD (12,26) | 0.3 | Buy |
| ADX (14) | 39.961 | Buy |
Santiment’s latest sentiment data shows confidence has returned much faster than price strength. That does not guarantee XRP price or Ethereum price will move lower, although it does increase the importance of watching nearby support and resistance levels.
Current technical analysis still leans slightly bearish for both assets even though recovery attempts have started. Buyers now need to prove that optimism can translate into stronger price action.
FAQs
Subscribe to our YouTube channel for daily crypto updates, market insights, and expert analysis.