Silver price has had a rough few weeks. After one of the most dramatic runs in recent memory (surging past $100 an ounce earlier this year) the metal has since collapsed back to around $59, grinding sideways with little sign of life as bulls struggle to find a reason to step back in.
It isn’t just silver feeling the pressure. Gold, which had been holding up better, took a big hit this week, crashing back to around $4,000 an ounce as tensions in the Middle East escalated once again, with the conflict in Iran rattling broader markets and sending investors scrambling for clarity.
In the middle of all this noise, Bloomberg Intelligence’s senior macro strategist Mike McGlone stepped forward with a stark warning that every silver holder needs to hear: the worst may not be over.
What you'll learn 👉
What Bloomberg’s Mike McGlone Actually Said About Silver Price
McGlone didn’t mince words. In a recent post, he warned that silver (sometimes referred to as the “devil’s metal”) may be about to live up to that nickname. His core argument is straightforward but sobering: silver’s surge above $100 in Q1 2026 was a classic too-far, too-fast move, and the second half of the year is now squarely focused on one question: how low can it go?
The analyst points to two key historical precedents that should give silver bulls pause. The previous highs near $50 in 1980 and again in 2011 (levels that took decades to reach) may now act as only the first major support zones on the way down, not the floor. That’s a significant statement. If silver continues to fall and loses the $50 level convincingly, there’s very little structural support between there and much lower prices.
Perhaps the most alarming data point McGlone raises is this: at the end of 2025, silver reached its greatest premium to its own 10-year moving average since 1979 (the year before the famous Hunt Brothers silver squeeze that ended in a spectacular crash. His point is clear) the metal rarely stays that far above its long-term mean for long, and that mean currently is at just $31. From $59 today, that would represent another 47% decline.
McGlone does acknowledge what’s different this time around. Inflation, as measured by the US CPI, is running at 4.2% – elevated, but nowhere near the 14.8% peak seen in 1980, which was the primary fuel behind that era’s precious metals mania. And while the runaway US budget deficit has been a popular argument for owning silver and Bitcoin, McGlone pushes back hard on this narrative.
With US debt-to-stock-market-cap sitting at just around 0.50, equities remain, in his words, the asset class that matters which indicate the macro backdrop isn’t nearly as silver-friendly as many bulls believe.
Silver Chart Analysis: Breaking Down the McGlone Chart
Alongside his warning, McGlone shared a chart that tells the story better than words can. Here’s what it shows:
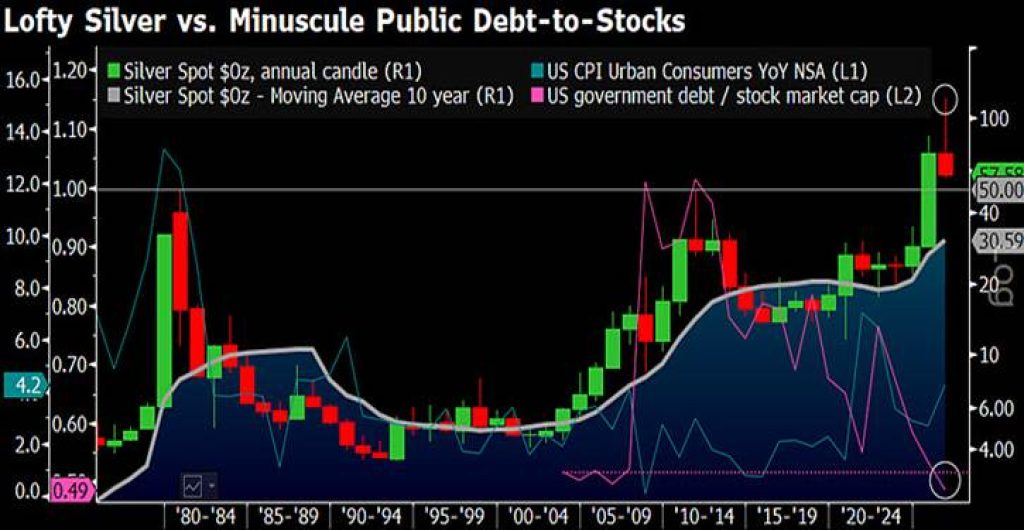
The chart overlays four key datasets spanning over 40 years: the silver spot price (annual candles), silver’s 10-year moving average, the US CPI year-over-year, and the US government debt-to-stock-market-cap ratio.
What immediately stands out is the 2025-2026 candle; a massive green spike that dwarfs everything before it, shooting past the $100 level and well above the long-term moving average (the grey band). This kind of deviation from the mean is historically rare and has always resolved the same way: a sharp reversion. The 1980 peak and the 2011 peak are both visible on the chart as previous spikes that were eventually dragged back down toward the moving average.
The CPI line (teal) shows inflation peaking and fading – removing one of the key fundamental arguments for owning silver at elevated prices. And the pink debt-to-market-cap line, rather than surging as silver bulls might hope, remains near historic lows, reinforcing McGlone’s point that equities (not hard assets) are still where the real capital is concentrated.
The 10-year moving average, at approximately $31, is the line to watch. Every major silver peak in the past 50 years has eventually been followed by a return to this level. The question is how quickly and how violently reversion happens.
Read also: Silver Price Could Crash to $54 Before Finding Support, Analyst Warns
Silver Price Prediction 2026: Our Take on Where This Goes From Here
McGlone’s warning deserves to be taken seriously, and we do. The setup he describes is textbook mean reversion, and the chart makes it visually undeniable. Silver went parabolic, got wildly extended from its long-term average, and is now paying the price. The drop from over $100 to $59 has already been brutal, but based on the historical patterns McGlone lays out, this correction may have further to run.
Our bear case: if the silver price loses the $50 level (the psychological and historical support McGlone flags) the next meaningful floor is somewhere in the $35 to $40 range, where previous consolidation zones and the rising long-term moving average would converge. A move toward $31 (the current 10-year MA) would only happen in a severe risk-off scenario, but it cannot be ruled out if macro conditions deteriorate.
Our base case: silver stabilizes in the $50 to $55 range over the coming months, finding support at the previous all-time high from 2011 before attempting a recovery. This would be a healthy consolidation and would help rebuild the technical base needed for the next leg higher.
Our bull case: if inflation re-accelerates (which is not out of the question given ongoing geopolitical instability and supply chain pressures) silver could find buyers well above $50 and retest the $70 to $80 range before year-end. But this scenario requires a clear macro catalyst that simply isn’t visible right now.
The bottom line: McGlone’s warning isn’t noise. It’s backed by 50 years of data, and it deserves a place in every silver investor’s risk management thinking right now. The devil’s metal has a reputation for humbling those who chase it, and right now, the chart indicates it isn’t done making its point.
Subscribe to our YouTube channel for daily crypto updates, market insights, and expert analysis.