Crypto markets continue to search for direction after a period of weakness, and today could prove important for Ethereum, XRP, and Dogecoin. Each of these major cryptocurrencies is sitting near key technical levels that may determine whether buyers regain control or sellers push prices lower.
Technical indicators paint a mixed picture across the board, which means traders will likely pay close attention to support and resistance zones throughout the day.
What you'll learn 👉
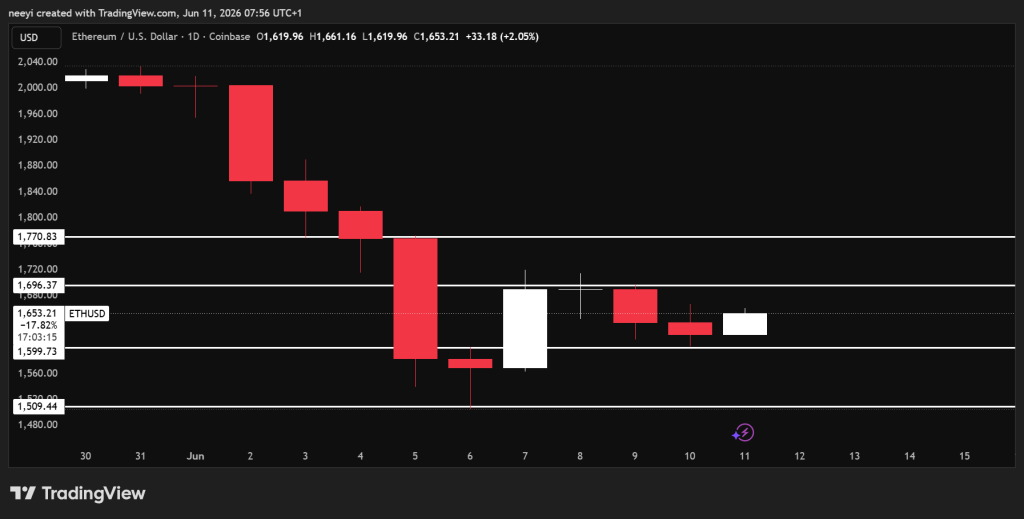
Ethereum Price Faces A Critical Test Near The $1,700 Resistance Level
Ethereum price has been showing early signs of recovery, but it remains weak until it breaks above the resistance at around $1,700. A move above this level today would strengthen the bullish outlook and could open the door for ETH price to climb toward $1,770.
Failure to hold the current area around $1,600 would create a different picture. A break lower could expose Ethereum to another drop toward the low end of the $1,500 region.
The technical indicators show a market that remains undecided. The RSI reading of 48.416 sits near the midpoint, which points to neutral momentum. Stochastic at 39.975 continues to flash a sell signal, which shows buying pressure remains limited. MACD stands at -27.62 and also indicates bearish momentum.
Several indicators offer a more optimistic view. The Ultimate Oscillator reading of 52.136 generates a buy signal, while Bull/Bear Power at 23.912 also favors buyers.
| Name Of Indicator | Metric | Interpretation Of Metric |
|---|---|---|
| RSI (14) | 48.416 | Neutral momentum with no clear trend dominance |
| STOCH (9,6) | 39.975 | Sell signal shows weak buying pressure |
| MACD (12,26) | -27.62 | Bearish momentum remains present |
| Ultimate Oscillator | 52.136 | Buy signal points to improving strength |
| Bull/Bear Power (13) | 23.912 | Buyers maintain a slight advantage |
A bullish scenario would emerge if Ethereum breaks above $1,700. Such a move could push ETH price toward $1,770 before the day ends.
A neutral scenario could develop if neither buyers nor sellers gain control. Under that outcome, Ethereum may continue trading between $1,600 and $1,700.
A bearish scenario would come into focus if ETH price falls below $1,600. That move could send Ethereum toward the lower end of the $1,500 region.
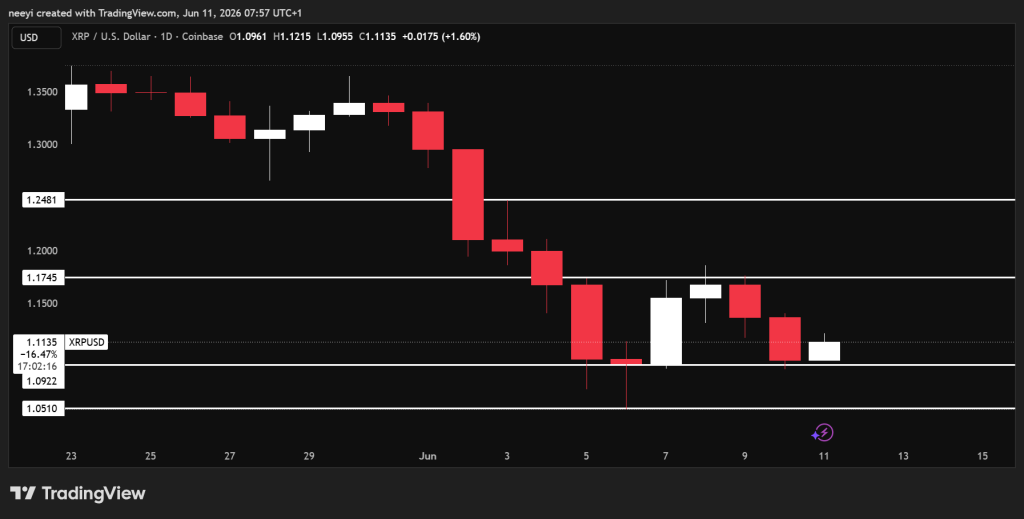
XRP Price Tries To Stabilize After Two Consecutive Bearish Sessions
Ripple’s XRP price now trades around $1.11 after cooling off following two bearish days. The immediate resistance sits near $1.17, while support remains close to $1.09.
Current indicators lean more heavily toward the bearish side. The RSI reading of 44.912 shows weak momentum. Stochastic stands at 27.103 and continues to generate a sell signal. MACD remains negative at -0.018, which points to ongoing downside pressure.
ADX comes in at 34.846. That reading suggests the current trend still carries reasonable strength. The Ultimate Oscillator remains below the midpoint at 48.455, and Bull/Bear Power has slipped into negative territory at -0.0128.
| Name Of Indicator | Metric | Interpretation Of Metric |
|---|---|---|
| RSI (14) | 44.912 | Weak momentum favors sellers |
| STOCH (9,6) | 27.103 | Sell signal remains active |
| MACD (12,26) | -0.018 | Bearish momentum continues |
| ADX (14) | 34.846 | Trend strength remains moderate |
| Ultimate Oscillator | 48.455 | Weak market participation |
| Bull/Bear Power (13) | -0.0128 | Sellers maintain a slight edge |
A bullish scenario would appear if XRP price breaks above $1.17. That move could allow Ripple to push into the $1.20 region.
A neutral scenario could keep XRP trading between $1.11 and $1.17 as buyers and sellers battle for control.
A bearish scenario would become more likely if XRP falls below $1.11. Such a breakdown could open the door for further downside pressure during the day.
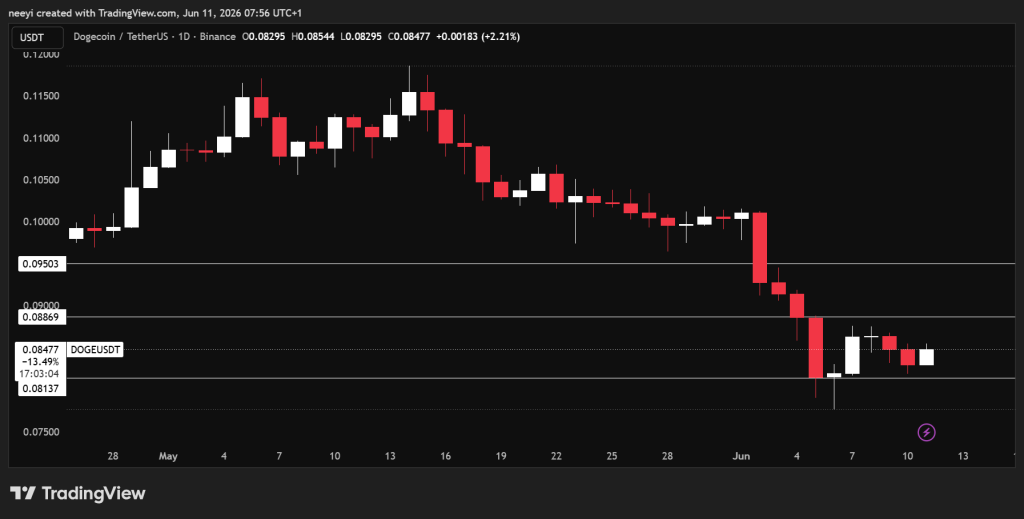
Dogecoin Price Holds Above Support As Buyers Defend Key Levels
Dogecoin price currently trades near $0.085. The main resistance level sits around $0.088, while support remains near $0.081.
DOGE price appears to be experiencing a retracement similar to Ethereum and XRP. The broader trend remains uncertain, although some indicators suggest buyers are still active beneath the surface.
RSI stands at 47.885, which indicates neutral momentum. Stochastic at 39.358 continues to issue a sell signal. MACD remains negative at -27.84 and points to lingering bearish pressure.
The picture improves when looking at the Ultimate Oscillator and Bull/Bear Power. Those indicators register buy signals at 52.213 and 19.084 respectively.
| Name Of Indicator | Metric | Interpretation Of Metric |
|---|---|---|
| RSI (14) | 47.885 | Neutral momentum conditions |
| STOCH (9,6) | 39.358 | Sell signal remains active |
| MACD (12,26) | -27.84 | Bearish momentum persists |
| Ultimate Oscillator | 52.213 | Buy signal supports recovery potential |
| Bull/Bear Power (13) | 19.084 | Buyers still show strength |
A bullish scenario would emerge if DOGE price breaks above $0.088. That move could target the $0.090 area before the session closes.
A neutral scenario could keep Dogecoin trading between $0.081 and $0.088 for the rest of the day.
A bearish scenario would develop if DOGE falls below $0.081. That breakdown could send the price toward the $0.07 region.
FAQs
Subscribe to our YouTube channel for daily crypto updates, market insights, and expert analysis.