
Kaspa finally got smart contracts. It’s the biggest milestone in the history of the project. Investors expected upside on the chart. Instead, the price action has been relatively quiet.
So what’s really going on here? When is Kaspa going to break out? According to analyst Jesse, the answer lies in the broader macroeconomic picture rather than any Kaspa-specific flaw. Jesse has been tracking liquidity conditions and Fed policy as the primary drivers of altcoin performance, and his read is that Kaspa is simply caught in a bad market backdrop.
What you'll learn 👉
Kaspa’s Smart Contract Launch: What Actually Happened
Kaspa activating smart contracts was a major technical achievement. The network finally supports programmable functionality, opening up use cases like DeFi, NFTs, and tokenized applications. For a project that built its reputation on fast block times and the GHOSTDAG consensus mechanism, this was the missing piece.
The community celebrated. The developers delivered on a long-standing roadmap promise. And yet, the price barely moved.
This isn’t necessarily a Kaspa-specific problem. The crypto market has become increasingly sensitive to liquidity conditions. Even major project upgrades often fail to move the needle when the broader tape is weak. Kaspa’s smart contract launch was important, but it coincided with a period when investors were pulling back from altcoins across the board.
Kaspa Chart Analysis
Looking at the 1-hour KAS/USDT chart, Kaspa has actually established a decent technical setup after several days of consolidation between $0.0275 and $0.0283. Buyers broke above resistance near $0.0282, causing an impulsive move to a local high around $0.02983.
Key support levels to watch:
- Immediate support: $0.02920–0.02930
- Major support: $0.02890–0.02900 (previous breakout level)
- Strong support: $0.02820–0.02840
Resistance levels ahead:
- Immediate: $0.02980–0.02985
- Next: $0.03020–0.03050
- Bullish target: $0.03100–0.03150
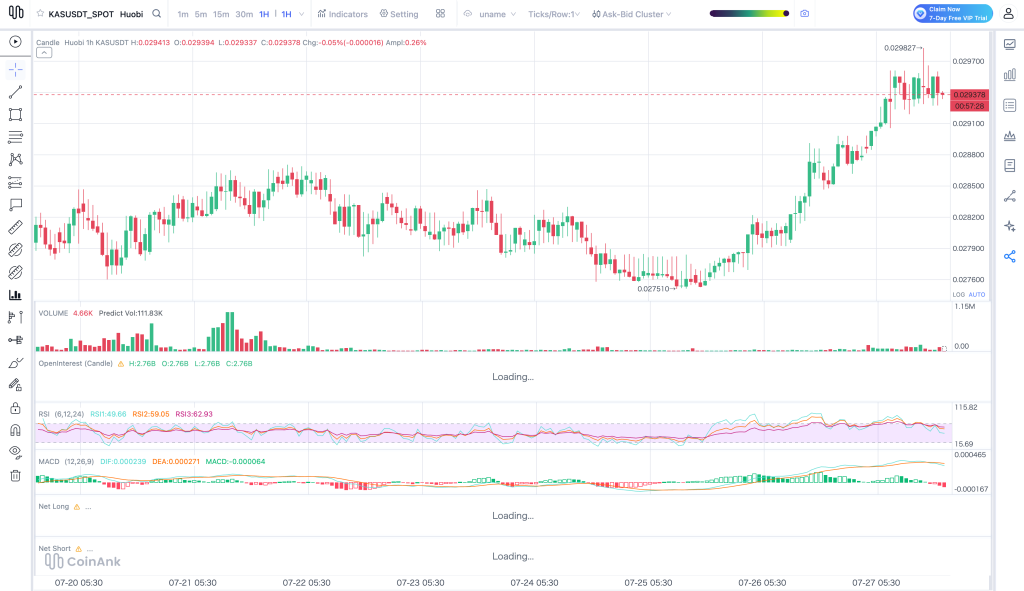
The RSI readings (RSI 6 at 49.7, RSI 12 at 59.1, RSI 24 at 62.9) suggest momentum remains bullish but has cooled from overbought conditions. That’s generally healthy. The MACD still shows a bullish crossover, though shrinking histogram bars show slowing momentum.
Volume expanded noticeably during the breakout above $0.0282 and confirms genuine buying interest. Since reaching the highs, volume has moderated while selling pressure remains limited.
The pattern resembles a bullish breakout followed by flag-like consolidation. As long as Kaspa holds above $0.0290, buyers retain the advantage.
Why the Broader Macro Picture Is Holding Kaspa Back
Here’s one trader’s theory on why Kaspa hasn’t pumped: it’s less about Kaspa-specific fundamentals and more about the macro tape.
The basic thesis is that crypto, especially mid-cap altcoins like Kaspa, responds to liquidity first and project quality second. When the market expects fewer rate cuts, a stronger dollar, and tighter financial conditions, speculative assets tend to get sold. Kaspa can get dragged down with the rest of the sector even without any token-specific bad news.
Kaspa has recently traded like a high-beta alt rather than a fully decoupled asset. Broad crypto selloffs can overpower its own story.
In practical terms, that means Kaspa can underperform when the market is risk-off and outperform only when altcoin rotation is strong enough to ignore macro caution.
The new Fed chair’s approach matters here too. Quantitative easing appears off the table for now. The Fed is relying strictly on rate cuts to add liquidity to the market. This could mean a prolonged period of tight conditions until inflation reaches the 2% target.
One trader’s read on the tape is that Kaspa is a “good asset, bad backdrop” scenario right now. When the Fed turns more supportive and altcoins start rotating, Kaspa could benefit quickly. Until then, macro may keep capping upside.
Read also: 5 Reasons It Could Be All Over for Pi Network Holders – PI Price at $0.08
Kaspa Price Prediction: What’s Next
For Kaspa to truly break out, we need to see one of three scenarios play out:
Option one: The Fed brings inflation down over time. This could take into 2027 or early 2028. It’s the slow path, but it would eventually restore the liquidity conditions that altcoins need.
Option two: Kaspa’s developers build enough on-chain activity that it drives liquidity and use case for Kaspa through the moon, naturally pushing price above key resistance levels. This is the bull case that doesn’t require macro help.
Option three: The Fed changes how it measures inflation through the new data task force. A surprise revision to inflation metrics could reprice Kaspa and the broader altcoin market to the upside, catching retail investors off guard.
In the shorter term, the technical setup is constructive. If buyers defend $0.0292–0.0293 and break above $0.02985, Kaspa could target $0.03020 and then $0.03050. Extended targets around $0.0310–0.0315 are possible if buying volume increases.
A break below $0.0290 could lead to a retest of $0.0286–0.0283. Losing $0.0282 would invalidate the current breakout structure.
Right now, Kaspa is showing one of its strongest short-term technical structures in recent sessions. But the next directional move depends heavily on whether macro conditions cooperate or continue to weigh on the entire altcoin sector.
Frequently Asked Questions
Subscribe to our YouTube channel for daily crypto updates, market insights, and expert analysis.