
Bitcoin is in freefall. The BTC price crashed 18% this week and broke below $60,000 for the first time since (early) 2024. The largest crypto has now lost more than half its value since peaking above $126,000 in October 2025. Ethereum trades below $1,800 for the first time since May 2025. The total crypto market cap erased roughly $200 billion in days.
Crypto is going through one of the worst phases in its history.
But Santiment just reported something interesting. The crowd is showing its highest level of pessimism since mid‑February. Words like “dead,” “finished,” “over,” and “gone” now dominate crypto discussions. Historically, those moments of widespread despair have appeared close to market bottoms.
What you'll learn 👉
Crowd Says “Crypto Is Dead” – That Signal Worked in February
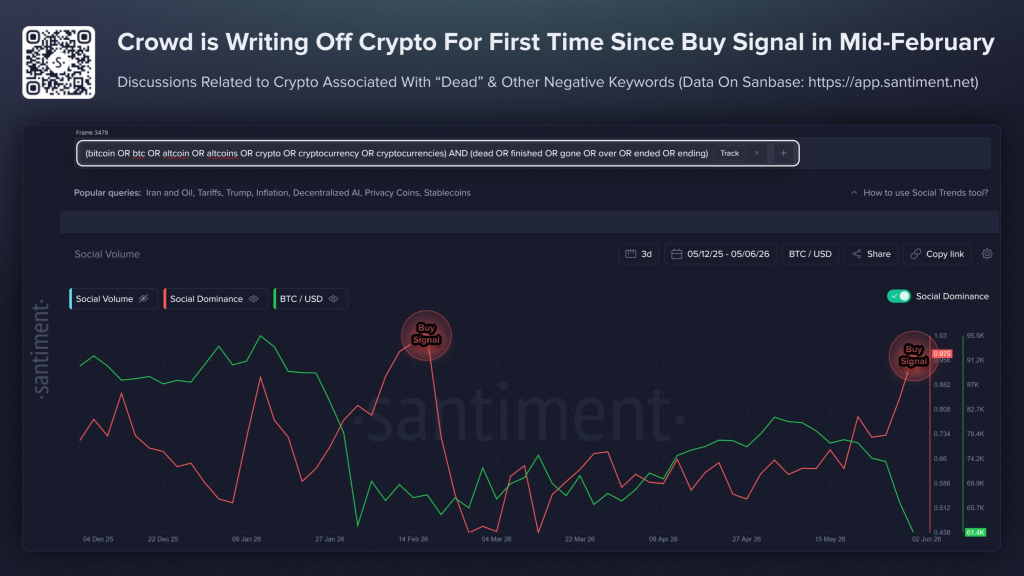
Santiment’s latest report tracks social media discussions pairing crypto terms with negative keywords like “dead,” “finished,” “gone,” “over,” and “ending.” The chart attached to the report shows these discussions reaching their highest levels in months, with Bitcoin price dropping in lockstep.
The previous major spike in these discussions occurred in mid‑February. That spike was followed by a notable market rebound.
Here is why the signal matters. When traders begin declaring an asset class “dead,” especially something as speculative‑driven as crypto, it typically signals that many sellers have already exited their positions. Less supply remains available to push prices significantly lower.
The chart’s social volume line now sits near levels last seen at the February bottom. The Santiment annotation on the chart highlights four previous “buy signals” marked by similar spikes in crowd despair. Each one preceded a bounce. The current spike is the largest since that February low.
Sentiment alone does not predict exact turning points. But historical patterns show that periods when investors are most convinced crypto is “finished” have frequently provided better‑than‑average opportunities for patient traders willing to take the opposite side of the crowd’s emotions.
Michaël van de Poppe: “Generational Buying Opportunity”
Michaël van de Poppe, a widely followed crypto analyst, tweeted his take on the crash. He called this a “generational buying opportunity” for Bitcoin.
He pointed to several indicators. The daily RSI is the lowest ever recorded. Sentiment is the worst he has seen in a long time. Ethereum’s daily RSI is also at record lows. And Bitcoin now sits at its 200‑week moving average.
Van de Poppe wrote: “If you were interested in Bitcoin at $90,000, then this is a bargain to buy on.”
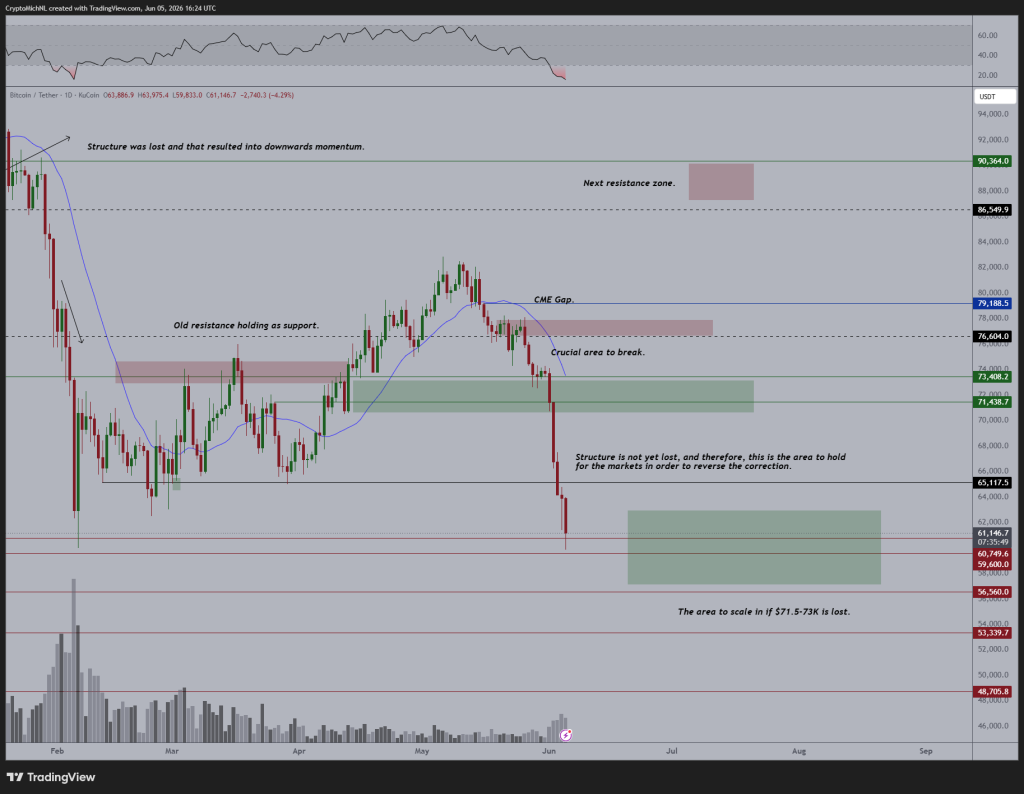
The chart van de Poppe shared shows Bitcoin testing the 200‑week moving average near $61,700, with annotations marking crucial support zones. The analyst expects price to sweep these lows but views the area as the right time to scale into positions.
200‑Week Moving Average: The Line in the Sand
The 200‑week moving average currently sits near $61,700–$62,000. Bitcoin touched this level on June 4 and broke below it on June 5. The 200‑week MA smooths roughly four years of weekly closes and has acted as a long‑term support backbone in past cycles.
Peter Brandt and other veteran traders have flagged this zone as critical. A weekly close below the 200‑week MA would mark the first time Bitcoin has broken this support since the 2022 bear market. A reclaim of the level would signal that buyers are stepping in at generational lows.
Van de Poppe’s chart highlights the 200‑week MA as the key line. Hold it, and the correction reverses. Lose it, and the next major support sits near $53,000–$55,000 based on on‑chain realized price models.
RSI Hits Record Lows – Selling Pressure Stretched
Bitcoin’s daily RSI dropped to 17 on June 4, the lowest reading ever recorded in any cycle. The weekly RSI fell to 32.07, a level not seen since the confirmed bear market lows of late 2022. Ethereum’s daily RSI hit similar record lows.
An RSI below 30 is textbook oversold. A reading of 17 is extreme. It does not guarantee an immediate bounce, but it shows selling pressure has become stretched to levels rarely seen in Bitcoin’s history.
Van de Poppe highlighted the daily RSI as one of his key signals. When the RSI reaches these depths, sellers are exhausted. The problem is that oversold conditions can persist during capitulation events. A bounce often requires a catalyst, not just a low reading.
Read more Bitcoin news: Bitcoin Price Didn’t Crash – Here’s Why the Government Wants BTC Low
ETF Outflows and Liquidations Intensified the Selling
The selling accelerated after stronger‑than‑expected U.S. non‑farm payrolls data. May payrolls surged by 172,000, more than double expectations of 85,000. The report effectively ruled out any near‑term Federal Reserve rate cuts, sending yields higher and risk assets lower.
The jobs data triggered over $1.5 billion in leveraged crypto liquidations within 24 hours. Long positions absorbed more than $1.3 billion of that total. Bitcoin’s total open interest fell roughly 25% to $23.2 billion, its lowest level since early April.
The liquidation cascade became self‑feeding. Exchanges automatically closed underwater long positions, creating additional selling pressure that accelerated the decline. By the time the dust settled, over $1.76 billion in total liquidations had been recorded, with longs taking the overwhelming majority of losses.
Strategy Now Holds a $13 Billion Unrealized Loss
Michael Saylor’s Strategy (formerly MicroStrategy) now sits on its largest unrealized loss ever. The company holds 843,706 BTC with an average cost basis of $75,699 per coin, totaling roughly $63.8 billion in acquisition cost. At current prices near $60,000, the position is worth approximately $50.6 billion, implying an unrealized loss of roughly $13 billion.
JUST IN: Michael Saylor's 'Strategy' now has a $13 billion unrealized loss on its Bitcoin investment. pic.twitter.com/K8yIGKATtZ
— Watcher.Guru (@WatcherGuru) June 5, 2026
Year‑to‑date, the portfolio is down 25.51%, representing about $18.18 billion in losses since the start of 2026. Jim Cramer called the move “extreme,” while Peter Schiff questioned how a supposed genius like Saylor could find himself underwater.
Saylor has downplayed the slide, insisting Bitcoin is fine. But the company just sold 32 BTC for the first time since 2022, raising $2.5 million to fund preferred stock distributions. Whether that sale was a one‑time event or the start of a larger hedging strategy remains an open question.
Where Can Bitcoin Go This Weekend?
The $60,000 level is now psychological more than technical. Price broke below it on June 5 but quickly reclaimed it, closing the session near $61,100. The 200‑week MA near $61,700 is the first real resistance overhead.
Three scenarios for the weekend:
Bullish case. Buyers defend $60,000 and push price back above the 200‑week MA. A weekend short squeeze could send Bitcoin toward $64,000‑$65,000, especially if ETF outflows slow and leveraged shorts get trapped.
Neutral case. Price chops sideways between $60,000 and $62,000. Thin weekend liquidity keeps moves muted. Traders wait for Monday’s Asian session to provide direction.
Bearish case. Bitcoin loses $60,000 on a weekend flush. Thin order books amplify the move, sending price toward $58,000 or lower. The next major support sits near $53,000‑$55,000, the realized price zone highlighted by on‑chain analysts.
The RSI at record lows suggests selling pressure is exhausted. The 200‑week MA offers a historical accumulation zone. And the crowd’s “crypto is dead” sentiment has marked bottoms before.
But catalysts matter. A weekend rebound requires buyers to step in with conviction. Without fresh demand – an ETF inflow reversal, a Fed pivot signal, or a major institutional announcement – Bitcoin could drift lower or chop sideways until next week’s economic data provides the next spark.
FAQs
Subscribe to our YouTube channel for daily crypto updates, market insights, and expert analysis.