
Bitcoin has already lost nearly half of its value since reaching a record high of $126,000 in October 2025. That decline has shaken confidence across the crypto market, yet some analysts believe the correction may still have more room to run before a true bottom forms.
BTC currently trades near $62,000, which means the world’s largest cryptocurrency remains far above its historical bear market lows. A growing number of analysts are now looking at previous Bitcoin cycles to understand what could happen next. One chart in particular is attracting attention because it points to a destination many investors hoped would never return: $30,000.
What you'll learn 👉
Several Major Forces Have Contributed To Bitcoin’s Current Decline
The BTC price collapse did not happen because of a single event. Multiple factors combined to create selling pressure across the market.
One of the biggest shocks came when Strategy, formerly known as MicroStrategy, disclosed its first Bitcoin sale since 2022. The company had built a reputation around accumulating BTC and holding through market downturns. That reputation played a major role in investor confidence. Once that narrative changed, liquidation pressure increased rapidly.
Another factor has been the global race to fund artificial intelligence infrastructure. Large amounts of capital have flowed into AI-related investments. Money that previously entered speculative crypto assets has increasingly moved elsewhere.
Institutional demand has also weakened. Spot Bitcoin ETFs in the United States have recorded weeks of net outflows worth billions of dollars. Those outflows removed a key source of buying pressure that helped push BTC above $100,000 during the 2025 rally.
Macroeconomic conditions have created additional challenges. Expectations for Federal Reserve rate cuts have been pushed back due to inflation concerns and mixed economic data. Geopolitical tensions involving the United States and Iran have added uncertainty. Progress on the Clarity Act has also slowed, leaving digital asset regulation unresolved.
Liquidity conditions have deteriorated as well. Bitcoin lost major psychological support levels at $100,000, $80,000, and $70,000 before falling into its current range.
Third Eye Sees Bitcoin Following The Same Historical Pattern Again
Crypto analyst Third Eye believes Bitcoin’s current correction looks remarkably similar to previous bear market cycles.
A look at the monthly chart shows a repeating structure. Bitcoin topped near $19,000 during the 2017 cycle before falling about 84% to a long term ascending support line. The next cycle peaked near $69,000 before declining roughly 77% to that same support area.
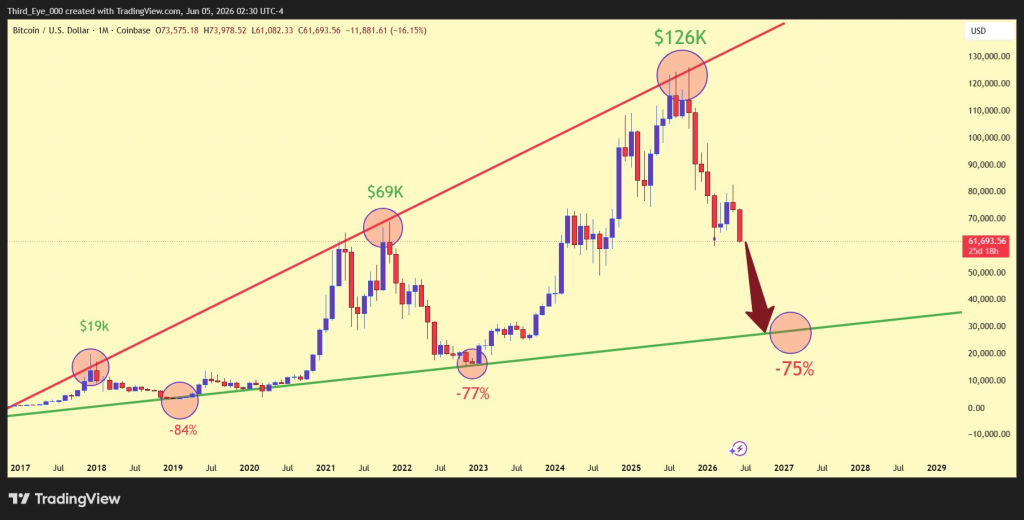
The analyst now argues that the latest peak at $126,000 could follow a similar path.
The chart projects a decline of approximately 75% from the all time high. Such a move would place Bitcoin near the $30,000 region sometime around mid 2027.
Third Eye describes the red trend line as the zone where market euphoria reaches extreme levels. The green trend line represents the area where major bear markets have historically ended. Every previous touch of that green support zone eventually produced substantial gains during the next cycle.
Read Also: ADA Price in Freefall – Cardano’s Loyal Community Now Faces Its Biggest Test
The analyst believes the current cycle remains consistent with Bitcoin’s long-term behavior. Historical data shows that deep corrections have repeatedly appeared after every major bull market peak.
Bitcoin Price Could Face More Pressure If Key Support Fails
Bitcoin currently trades around $62,000. The next important support level sits near $59,000.
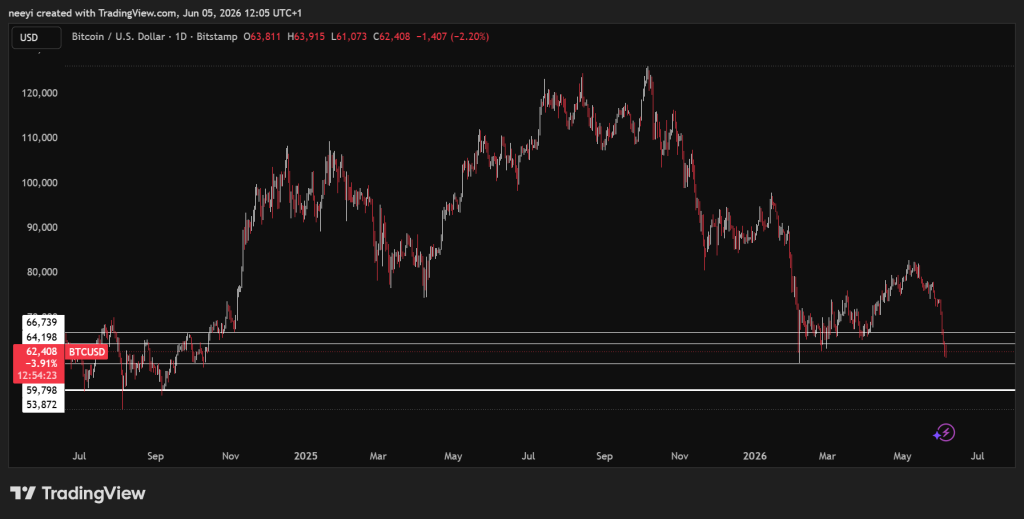
A decisive break below that area could expose BTC to a deeper decline toward $53,000. Continued weakness in momentum would increase the probability of further downside over the coming months.
Historical cycles show that Bitcoin often falls much further than most market participants expect during bear markets. If the pattern highlighted by Third Eye continues to play out, a move below $40,000 cannot be ruled out.
That does not guarantee Bitcoin will reach $30,000. Markets rarely follow any single roadmap perfectly. Even so, the chart serves as a reminder that previous Bitcoin cycles produced declines of 75% to 84% before lasting bottoms finally emerged.
FAQs
Subscribe to our YouTube channel for daily crypto updates, market insights, and expert analysis.