
The crypto market inched up a little on the morning of May 10, 2026. The total market cap rose just 0.14% to $2.69 trillion as traders moved money between big coins and smaller ones. Some coins kept climbing over the weekend, but others stalled out when they hit resistance.
The XRP price slipped almost 1% during the past 24 hours after failing to extend above a key resistance region. Uniswap price moved in the opposite direction and remains one of the strongest performers in the market today with gains above 5%. SEI price also stayed positive, adding close to 2% as buyers defended the latest breakout move.
A closer look at the charts shows three very different setups developing across XRP price, UNI price, and SEI price today.
What you'll learn 👉
Ripple’s XRP Price Struggles Below $1.42 Resistance
XRP traded near $1.41 at writing after another failed attempt to reclaim the upper resistance zone near $1.43. We had a look at the chart and the structure still shows the market moving sideways after the strong rally recorded in mid-April.
The latest candles also show reduced volatility compared to previous sessions. Buyers defended the $1.38 region twice during the past week, though the XRP price has not managed to produce enough strength for a clean breakout above recent highs. That leaves the market trapped inside a narrow short-term range.
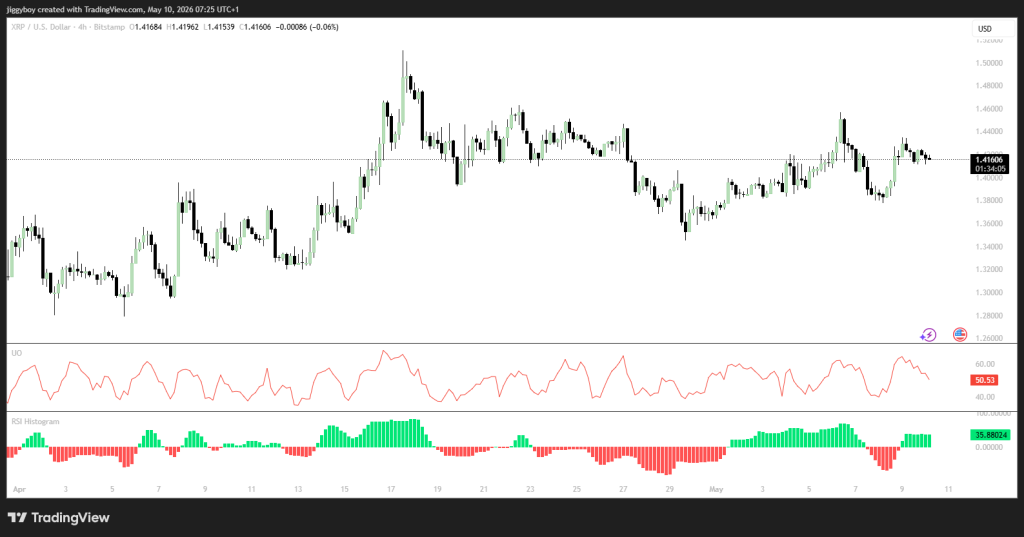
Momentum indicators remain mixed. The RSI reading stands at 53.16, which keeps XRP inside neutral territory with no extreme buying pressure visible yet. STOCH(9,6) reads 62.03, showing buyers still control short-term momentum slightly despite the latest slowdown.
MACD remains positive at 0.00390 and still supports bullish continuation if the XRP price pushes above resistance later today. The Ultimate Oscillator reads 50.3, showing balanced market conditions across multiple timeframes. Histogram data near 35.88 also supports moderate bullish pressure returning after the latest rebound from support.
| Name Of Indicator | Metrics | Interpretation Of Reading |
|---|---|---|
| RSI (14) | 53.16 | Neutral |
| STOCH (9,6) | 62.03 | Bullish |
| MACD (12,26) | 0.00390 | Bullish |
| Ultimate Oscillator | 50.3 | Neutral |
| Histogram | 35.88 | Bullish |
XRP Price Prediction for Today
The bullish scenario for XRP depends on a breakout above $1.43. That move could open the path toward $1.46 afterward.
The neutral scenario may keep the XRP price trading between $1.43 and $1.38 throughout today’s session.
The bearish scenario appears if XRP falls below $1.38. That breakdown could expose the next downside area near $1.35.
Uniswap Price Pushes Toward $4 Resistance
UNI traded close to $3.97 after extending its strong rally during the weekend session. We had a look at the chart and buyers remain firmly in control after the market climbed fast from the $3.20 region earlier this month.
The latest candles also show aggressive buying pressure returning after a brief pause near $3.70. The UNI price already tested the psychological $4.00 level and came very close to breaking higher again during the latest 4-hour candle. Momentum remains very strong, though some overheating signals are starting to appear.
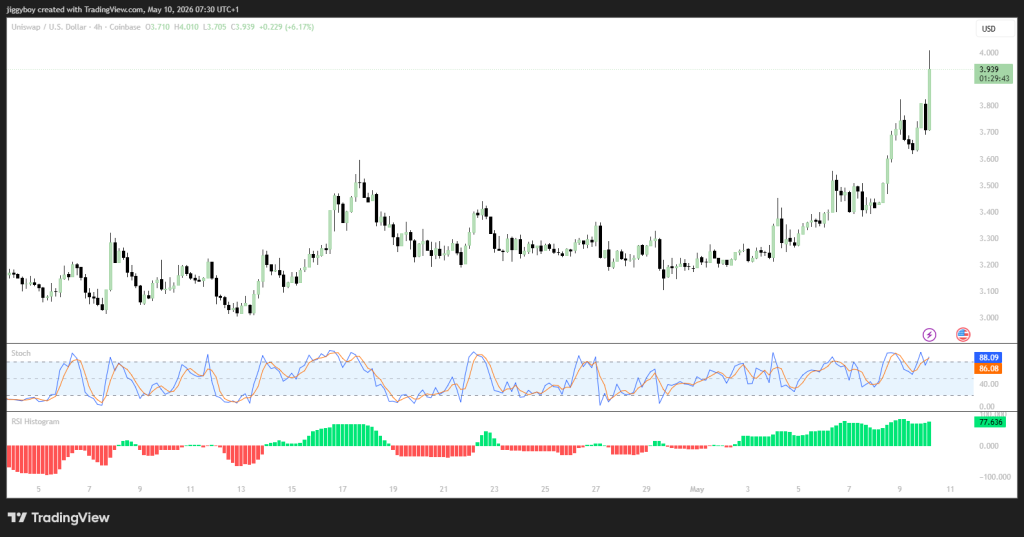
RSI(14) now reads 72.25, placing UNI price inside overbought territory. STOCH(9,6) also climbed to 90.44, which shows strong short-term momentum but also increases the possibility of temporary cooldown candles appearing later today.
MACD remains strongly bullish at 0.113 and still supports continued upside pressure. The Ultimate Oscillator stands at 62.57, showing buying activity remains dominant across several timeframes. Histogram data near 77.63 also confirms strong bullish momentum remains active after the latest breakout move.
| Name Of Indicator | Metrics | Interpretation Of Reading |
|---|---|---|
| RSI (14) | 72.25 | Bullish |
| STOCH (9,6) | 90.44 | Bullish |
| MACD (12,26) | 0.113 | Bullish |
| Ultimate Oscillator | 62.57 | Bullish |
| Histogram | 77.63 | Bullish |
UNI Price Prediction for Today
The bullish scenario for Uniswap requires a successful move above $4.00. That breakout could send the price toward $4.15 afterward.
The neutral scenario could keep the UNI price trading between $4.00 and $3.75 during today’s session.
The bearish scenario becomes possible if UNI drops below $3.75. That move could expose the next support area near $3.55.
Read Also: Grok AI Predicts Kaspa (KAS) Price if the Fastest Proof-of-Work Chain Goes Mainstream
SEI Price Holds Strong After Breakout
SEI traded near $0.06836 at writing after extending its breakout from the early May consolidation zone. We had a look at the chart and the market continues printing higher highs after buyers reclaimed control above $0.064 earlier this week.
The latest rally pushed the SEI price close to the psychological $0.07 level before mild profit-taking appeared. Even with the small rejection near local highs, the broader structure still favors buyers because higher lows continue forming across the chart.
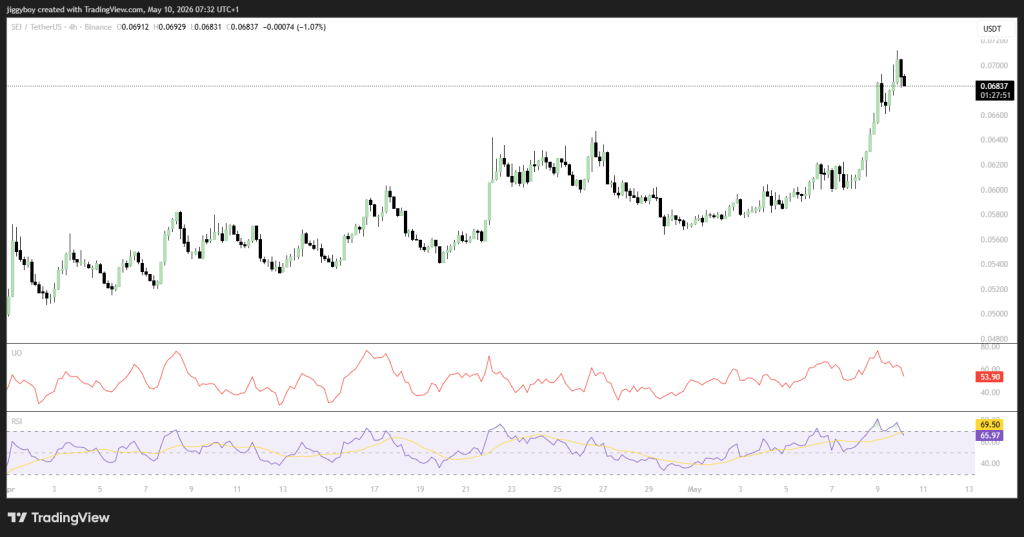
The momentum numbers still look good for buyers. The RSI is at 65.82. That means buyers have solid control, but the price hasn’t run too hot yet. The STOCH reading is 74.04, which still leans in favor of buyers after the latest move up.
MACD is positive at 0.00236 and points toward higher prices ahead. The Ultimate Oscillator is at 53.90, a sign that buying pressure has been steady across different time frames. The histogram at 88.29 also shows that buyers still have plenty of energy behind them after the latest breakout.
| Name Of Indicator | Metrics | Interpretation Of Reading |
|---|---|---|
| RSI (14) | 65.82 | Bullish |
| STOCH (9,6) | 74.04 | Bullish |
| MACD (12,26) | 0.00236 | Bullish |
| Ultimate Oscillator | 53.90 | Bullish |
| Histogram | 88.29 | Bullish |
SEI Price Prediction for Today
The bullish scenario for SEI depends on a clean breakout above $0.07. That move could push SEI price toward $0.072 afterward.
The likely case may keep the SEI price trading between $0.07 and $0.066 during today’s session.
The bearish path appears if SEI falls below $0.066. That breakdown could expose the next support zone near $0.063.
Frequently Asked Questions
Subscribe to our YouTube channel for daily crypto updates, market insights, and expert analysis.