Solana, Pepe, and XRP all moved within tight ranges over the past 24 hours, showing no strong breakout or breakdown across the market. Price action stayed controlled, with each asset holding close to key levels as buyers and sellers remained evenly matched.
This kind of setup usually points to a market waiting for a trigger. Solana, Pepe, and XRP are now sitting near important support and resistance zones, which makes today’s price reaction around those levels especially important.
What you'll learn 👉
Solana Price Action Shows Tight Range With Slight Upward Bias
The last 24 hours brought a slow and controlled move for Solana, with price opening close to $86 and staying within a narrow band throughout the session.
The low formed around $85, and the high pushed toward $87 before settling near $86.33. That leaves a modest gain of about 0.76%, which points to steady accumulation instead of a strong directional move.
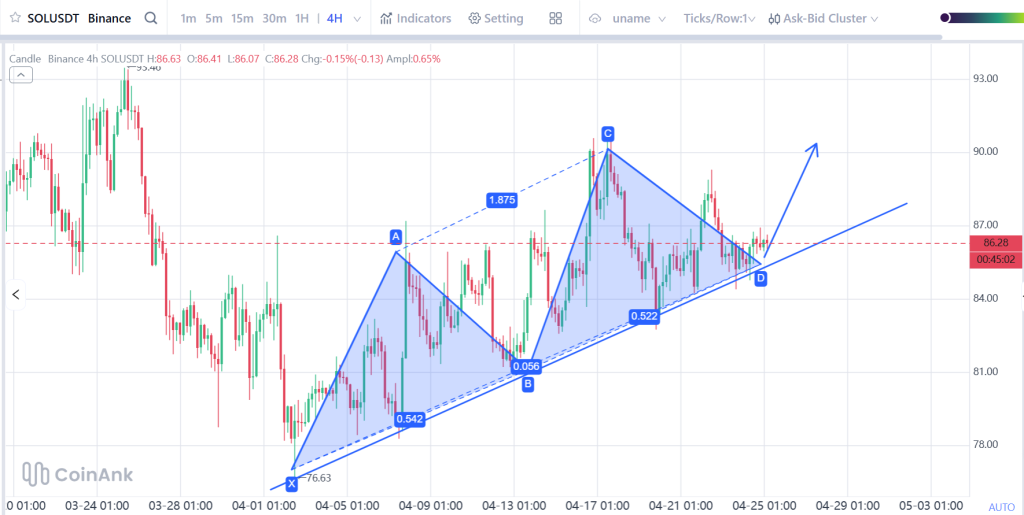
Buyers and sellers are both active, yet neither side has taken control in a meaningful way. Price continues to compress, and that often leads to a breakout once pressure builds.
Key levels remain very clear for today. Immediate resistance sits near $86.5, which aligns with the recent high. A clean move above that level could open the path toward $88. Support rests around $85, with a deeper safety zone near $84.5 if weakness expands.
Solana Indicator Snapshot Shows Neutral Market Conditions
| Indicator | Value | Interpretation |
|---|---|---|
| Price | $86.33 | Sitting near key averages |
| 7 SMA | $86.31 | Short term trend flat |
| 30 SMA | $86.10 | Slightly below price |
| RSI 14 | 50 | Neutral momentum |
| RSI 7 | 45 | Slight short term softness |
| MACD | ~0.09 | Flat momentum |
| Histogram | -0.01 | Slight momentum fade |
Solana Price Prediction For Today
Solana sits in a tight decision zone, which makes today heavily dependent on how price reacts around $85.5 and $86.5.
A bullish outcome requires price to stay above support and push through $86.5 with stronger participation. That could allow a move toward $88 as momentum improves.
A neutral path keeps price locked between $85.5 and $86.5. That would extend the current consolidation and keep indicators balanced.
A bearish shift begins if price drops below $85.5 and holds there. That could lead to a move toward $84, especially if broader market sentiment weakens.
Pepe Price Action Remains Calm With Slight Upward Drift
Pepe followed a similar pattern but on a smaller scale. Price moved between $0.0000038078 and $0.0000038850, eventually settling close to the top of that range near $0.0000038822.
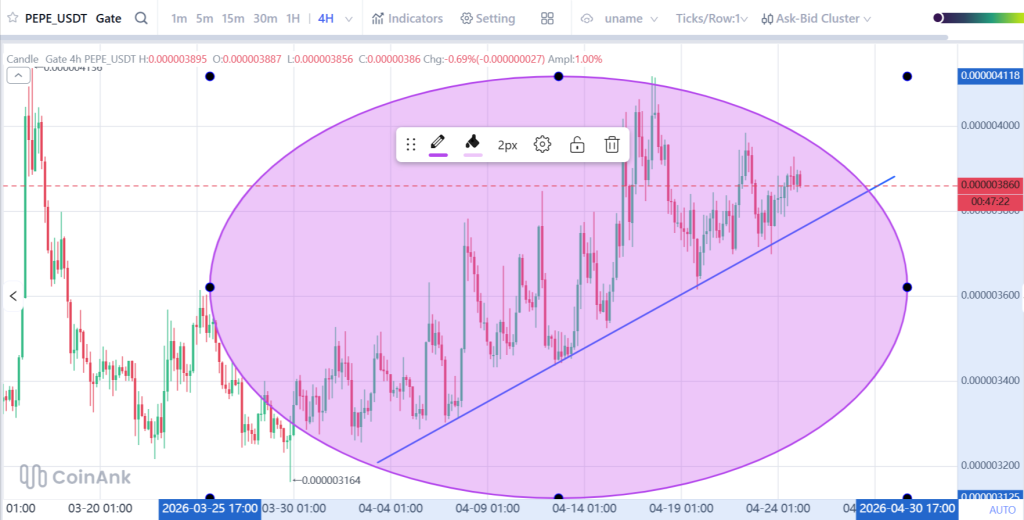
This slow climb suggests mild buying pressure, yet it lacks the strength needed for a breakout. The structure remains controlled, and volatility is still compressed.
Resistance sits at $0.0000038850, with a potential extension toward $0.00000392 if that level breaks. Support is located between $0.00000381 and $0.00000382, with deeper backing near $0.00000375.
Pepe Indicator Snapshot Shows Slightly Constructive Setup
| Indicator | Value | Interpretation |
|---|---|---|
| Price | 0.0000038822 | Slightly above averages |
| 7 SMA | 0.0000038791 | Short term support |
| 30 SMA | 0.0000038614 | Under price |
| RSI 14 | 53.5 | Mild bullish tilt |
| RSI 7 | 49.36 | Neutral |
| MACD | Slightly positive | Weak upward bias |
| Histogram | Slightly negative | Momentum flattening |
Pepe Price Prediction For Today
Pepe remains stable, though direction will depend on whether it escapes the current range.
A bullish move requires price to hold support and break above 0.0000038850. That could lead to a push toward 0.00000390 or slightly higher.
A neutral outcome keeps price moving between 0.00000381 and 0.00000389. That would confirm continued consolidation.
A bearish case develops if price falls below 0.00000381 and stays there. That could open a move toward 0.00000375.
XRP Price Action Shows Sideways Movement With Weak Momentum
XRP delivered the tightest structure among the three assets. Price stayed mostly between $1.425 and $1.45, finishing near $1.43 after repeated rejections at the upper boundary.
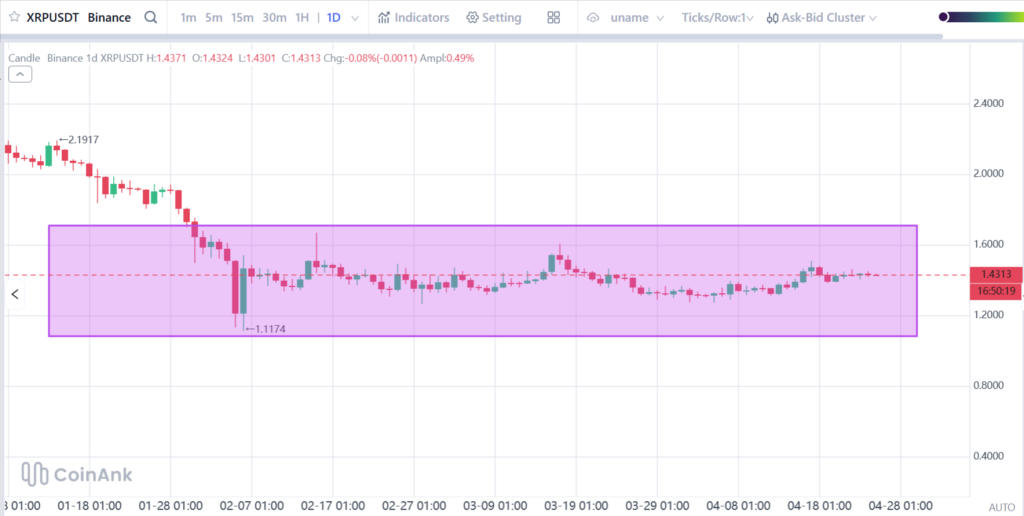
This kind of movement often signals equilibrium. Buyers defend support, sellers protect resistance, and price remains trapped in a narrow range.
Resistance stands at $1.44, with a higher target near $1.46 if that level breaks. Support sits at $1.425, followed by a lower zone near $1.41.
XRP Indicator Snapshot Shows Slight Downside Pressure
| Indicator | Value | Interpretation |
|---|---|---|
| Price | $1.43 | Near short term average |
| 7 SMA | $1.43 | Neutral |
| 30 SMA | $1.44 | Slight resistance above |
| RSI 14 | 46.46 | Mild bearish tilt |
| RSI 7 | 40.7 | Weak short term momentum |
| MACD | Slightly positive | Losing strength |
| Histogram | Negative | Momentum fading |
XRP Price Prediction For Today
XRP appears slightly weaker compared to Solana and Pepe, though it still holds within a stable range.
A bullish scenario needs price to reclaim $1.44 and hold above it. That could push price toward $1.45 or $1.46.
A neutral outcome keeps XRP moving between $1.43 and $1.44. That would extend the sideways structure seen over the past day.
A bearish scenario develops if price breaks below $1.43 and remains under that level. That could lead to a move toward $1.41.
FAQs
Subscribe to our YouTube channel for daily crypto updates, market insights, and expert analysis.