Despite some recent buying pressure, the presence of a strong resistance zone indicates potential hurdles for a short-term rally. Let’s delve into the details.
What you'll learn 👉
Resistance Zone Poses Challenges for Solana
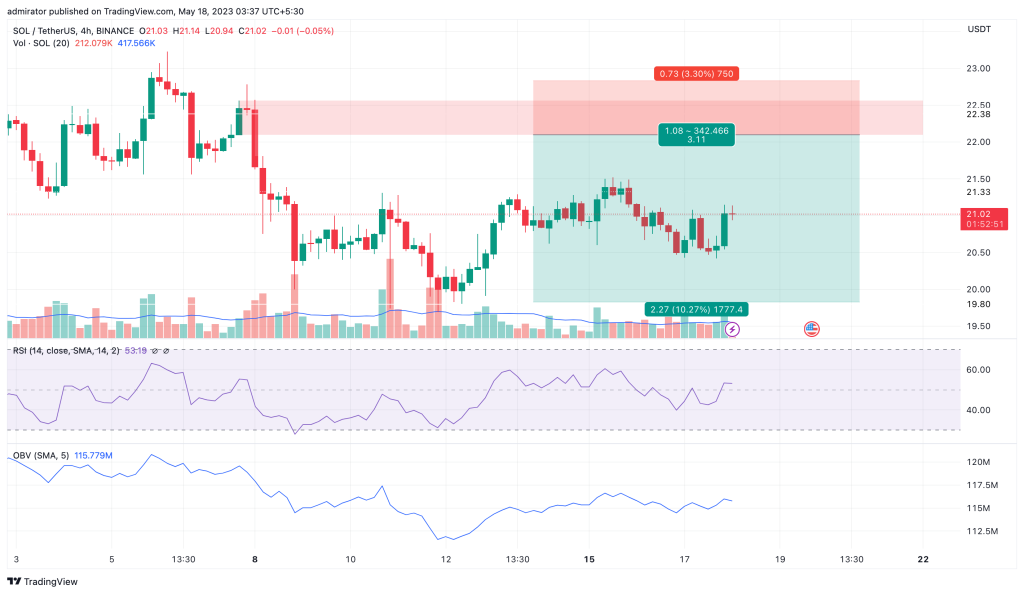
On the H4 timeframe, Solana’s price action has encountered a robust resistance zone within the $21.8 to $22.5 range. This zone is formed by the convergence of the Fibonacci Vertical Grid (FVG) and a bearish Order Block (OB), creating a formidable barrier for upward movement. Traders should be aware of this strong resistance area and closely monitor Solana’s price action within it.

Bearish Signals Offset Bullish Momentum
While there have been instances of upward momentum and buying pressure, it is important to note that bearish signals have emerged, raising concerns about the sustainability of a short-term rally. Traders should pay attention to two key indicators: the On-Balance Volume (OBV) and the Relative Strength Index (RSI).
The OBV indicator, which gauges the cumulative buying and selling pressure, has not shown a significant increase in demand for Solana. This lack of notable upward movement suggests a potential lack of buying interest to support a sustained rally.
Additionally, the RSI, a commonly followed momentum oscillator, has failed to exhibit strong bullish momentum. This indicates a potential weakening of the buying pressure and raises doubts about the likelihood of a significant price increase in the short term.
Read also:
- Best Projects on Solana – Top DeFi Coins on SOL Blockchain
- Best Solana (SOL) Wallets (Mobile, Desktop, Hardware)
Short-Term Bearish Outlook
Considering the bearish signals and the strong resistance zone, traders should approach Solana with caution and consider a more conservative trading strategy. The current analysis suggests that Solana’s price may struggle to surpass the resistance zone, making a short-term reversal more likely than a substantial rally.
Trading Plan
Based on the provided bearish trading opinion, traders may consider a short position entry at $22.1, aligning with the expected resistance zone. The exit point could be around $19.8, indicating a potential profit-taking area. To manage risk, a stop-loss order should be placed at $22.8, ensuring that losses are limited if the trade does not go as planned.
Risk-to-Reward Ratio
Given the bearish analysis, the risk-to-reward ratio (R:R) for this trade is calculated to be 3:1.
Conclusion
n conclusion, Solana faces a significant resistance zone that poses challenges for further upward movement. Despite some recent buying pressure, bearish signals in the form of the OBV and RSI indicators suggest a more cautious outlook. Traders are advised to closely monitor price action and consider a conservative trading approach. It is essential to conduct thorough analysis and evaluate different factors before making any trading decisions, especially in the dynamic and volatile cryptocurrency market.


