XRP price is under heavy pressure heading into October 15, with the token trading around $1.325 after falling more than 3% over the latest 24-hour period.
The move comes as the broader crypto market reacts to hotter-than-expected U.S. inflation data. September CPI rose 0.6% month over month and 3.7% year over year, above market expectations. That pushed Treasury yields and the U.S. dollar higher and increased speculation that the Federal Reserve may keep monetary policy tighter for longer. Reuters
That backdrop has weighed on Bitcoin, Ethereum and altcoins, with XRP now pressing against an important support area near its recent low.
What you'll learn 👉
XRP Price Drops Back Toward $1.31 Support
I analyzed the XRP/USDT two-hour chart on Binance, where XRP is trading near $1.325.
The chart shows a clear sequence of lower highs and lower lows since the beginning of October.
XRP failed to hold above the $1.40 area and then accelerated lower, bringing price back close to the recent local low at $1.3103.
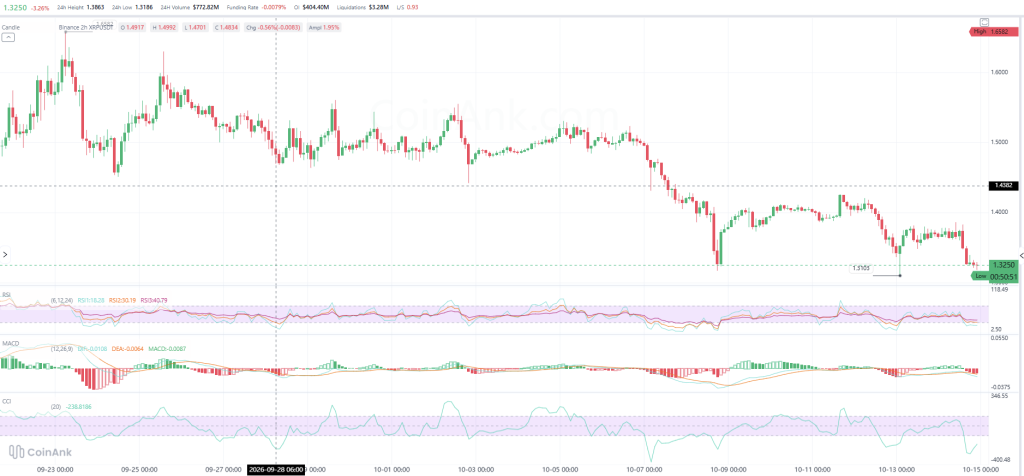
The latest market data shown on the chart includes:
- 24-hour high: $1.3863
- 24-hour low: $1.3186
- 24-hour volume: about $772.8 million
- funding rate: -0.0079%
- open interest: about $404.4 million
- liquidations: about $3.28 million
The negative funding rate also shows that derivatives positioning has shifted more bearish.
The immediate support area is now around $1.31-$1.32.
If that fails, $1.30 becomes the next psychological level to watch.
On the upside, XRP first needs to recover $1.35, followed by the $1.38-$1.40 area.
XRP Indicators Are Deeply Oversold
The short-term indicators are now giving much weaker readings than they did earlier this week.
The RSI values on the chart are:
- RSI 6: 18.28
- RSI 12: 30.19
- RSI 24: 40.79
The six-period RSI is deeply oversold, and the 12-period reading is sitting around the traditional oversold threshold.
That raises the possibility of a short-term relief bounce, but oversold conditions alone do not confirm a bottom.
MACD remains bearish.
The chart shows DIF near -0.0108, DEA around -0.0064 and the histogram near -0.0087.
That means downside momentum is still active.
CCI is even more extreme at roughly -238.8, another sign that XRP has moved far below its recent average.
Taken together, the indicators show an overstretched market, but momentum still favors sellers.
Read also: Bitcoin and XRP Slip Into Fear as Ethereum Becomes Crypto’s Crowd Favorite
XRP Price Prediction for Today
The $1.31-$1.32 area is now the key level for October 15.
| Scenario | Confirmation | Potential path |
|---|---|---|
| Bullish | XRP holds $1.31-$1.32 and reclaims $1.35 | $1.38, then $1.40-$1.42 |
| Neutral | XRP remains between $1.31 and $1.35 | Consolidation before the next move |
| Bearish | XRP loses $1.31 | $1.30, followed by $1.27-$1.28 |
The bullish case is mainly based on how oversold XRP has become.
From $1.325 to $1.38, XRP would need to recover about 4.2%. A move back to $1.40 would represent roughly 5.7% upside.
The bearish scenario becomes more relevant if the recent $1.3103 low fails.
A drop from $1.325 to $1.28 would equal approximately 3.4% downside, with $1.30 acting as the first psychological checkpoint.
For now, the chart does not confirm a reversal.
For more financial news and price predictions, click here.
Subscribe to our YouTube channel for daily crypto updates, market insights, and expert analysis.