
Quant is squeezing into one of its tightest technical structures in weeks, with QNT trading around $199-$200 as buyers and sellers battle near the tip of a symmetrical triangle.
Analyst Deniz Karasoy believes that compression could soon end.
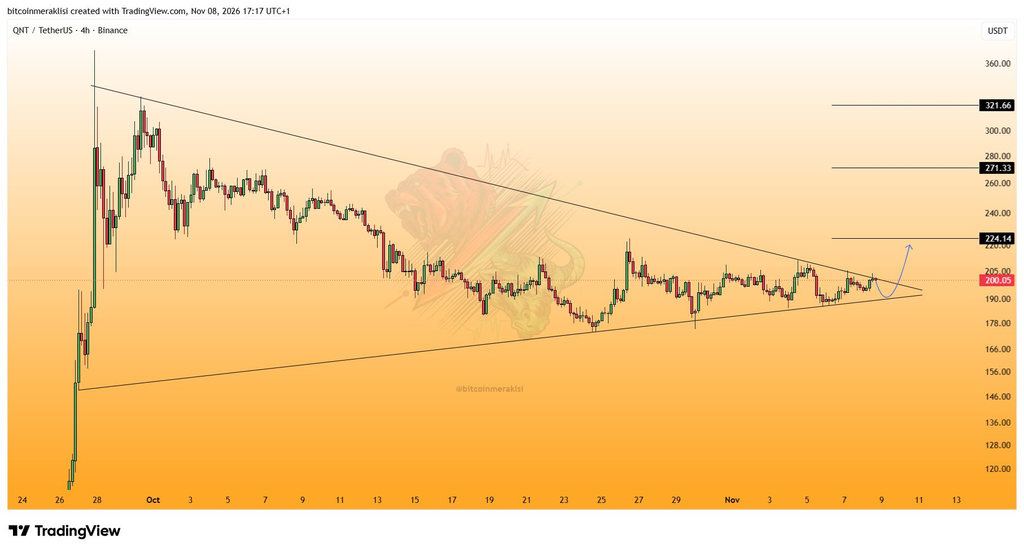
His latest 4-hour chart shows Quant trapped between a long descending resistance line and a rising support trendline. With almost no room left inside the pattern, Karasoy says an upside break could quickly send QNT toward higher targets.
The first major level on his chart sits around $224.
What you'll learn 👉
QNT Price Is Compressing Around $190-$205
The chart shows Quant spending most of the past few weeks between roughly $185 and $205.
A descending trendline from the late-September highs has repeatedly capped rallies, while a rising support line from the October lows has prevented sellers from pushing price materially lower.
Those two lines are now converging.
That creates the symmetrical triangle Karasoy is watching.
QNT is currently sitting near $200, almost exactly in the middle of the final squeeze.
Recent price data supports that picture.
Quant traded as high as roughly $205 on November 7 after rebounding from around $186 earlier in the week. On November 8, QNT remained close to $199, outperforming a broader crypto market that was still struggling to recover.
Quant Price Outlook: $205 Is the First Breakout Test
Karasoy’s bullish path depends on QNT getting above the descending resistance.
That puts approximately $203-$205 at the first meaningful test.
Recent independent technical analysis also identified resistance around $203.24, which makes this area more important than a random trendline touch.
A clean 4-hour close above that zone would strengthen the breakout case.
From there, Karasoy’s first target sits at $224.14.
That would represent a gain of roughly 12% from $200.
The chart then shows larger targets at $271.33 and $321.66 if momentum continues.
Those levels imply progressively more aggressive upside, so they should be treated as later targets rather than immediate expectations.
Quant Has Already Shown Relative Strength
One reason the setup is interesting is that QNT has held up reasonably well during a difficult week for crypto.
Quant dropped more than 7% on November 5, falling from above $203 to below $189 during the broader market selloff.
But buyers stepped in quickly.
QNT then recovered almost 3% on November 6, added another 1% on November 7, and remained close to $200 on November 8.
CoinMarketCap’s latest analysis also noted that QNT was outperforming Bitcoin and showing some independent strength rather than simply following the broader market lower. It identified $185 as an important support area and roughly $214-$215 as the next Fibonacci resistance.
That fits Karasoy’s setup well.
What Happens If the Triangle Breaks Down?
The bullish scenario is not guaranteed.
If QNT fails near $203-$205 and breaks below the rising support line, the triangle would resolve in the opposite direction.
The first area to watch would be around $190.
Below that, $185 becomes more important, followed by the recent swing low near $174.
That makes the current setup relatively clean.
Above $205, the chart starts opening toward $214 and then Karasoy’s $224 target.
Below $185, the bullish structure weakens considerably.
For now, Quant is still inside the triangle.
For more crypto news and price predictions, click here.
Subscribe to our YouTube channel for daily crypto updates, market insights, and expert analysis.