
The XRP price is dipping 4.5% today, in line with how other top altcoins are performing. All gains that were made at the beginning of the week are now mostly gone, and XRP is now trading at $2.25.
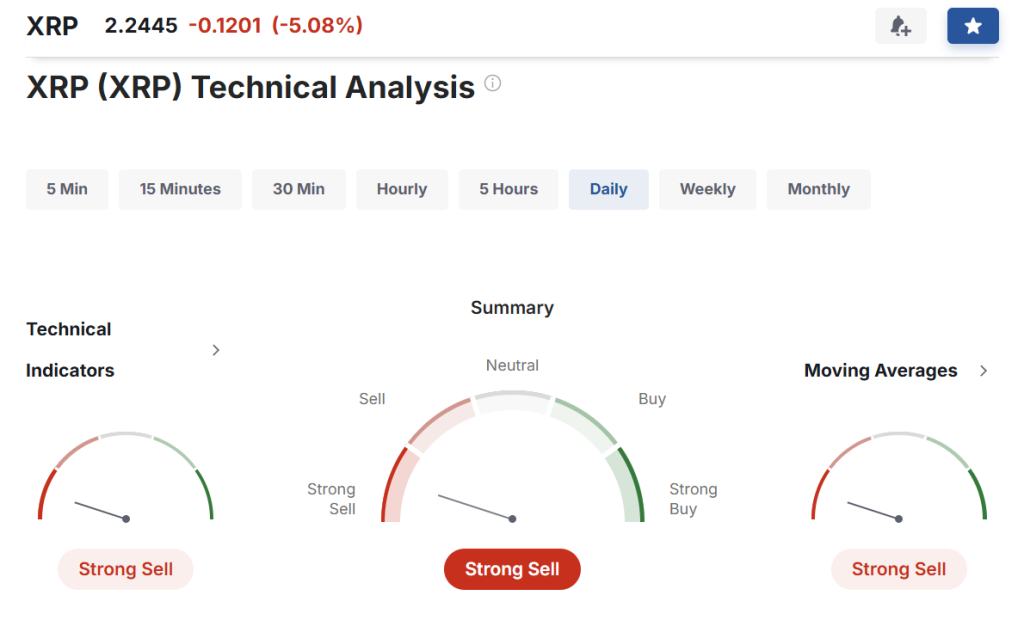
At the beginning of the week, we predicted the XRP price could stay in the $2.20 – 2.50 range in the bearish scenario. Let’s have a look at some technicals on a daily timeframe for XRP and estimate where the XRP price could be headed today.
What you'll learn 👉
XRP Chart: Technical Indicators Analysis
RSI(14) is 44.31 The Relative Strength Index (RSI) of 44.31 suggests that XRP is currently in a neutral territory. With the reading below 50, it indicates slight bearish sentiment, but not an extreme oversold condition.
MACD(12,26) is 0.018 The Moving Average Convergence Divergence (MACD) at 0.018 shows a very weak bullish momentum. This minimal positive value suggests that short-term and long-term moving averages are close to each other, indicating limited price movement.
CCI(14) is -139.6054 The Commodity Channel Index (CCI) is negative and below -100, which typically signals that XRP is currently experiencing significant selling pressure. This could indicate a potential continued downward trend in the short term.
Ultimate Oscillator is 41.119 At 41.119, the Ultimate Oscillator shows below-average buying pressure. This suggests that the current market sentiment for XRP is somewhat bearish and lacks strong buying momentum.
ROC is -4.22 The Rate of Change (ROC) at -4.22 confirms a negative price momentum. This negative value indicates that XRP’s price has decreased compared to its recent historical prices.
Bull/Bear Power(13) is -0.1371 A negative Bull/Bear Power suggests that bears are currently in control of the market. This implies that sellers are exerting more pressure on the XRP price than buyers.
When it comes to legal battler with the SEC – They officially dropped their lawsuit against Ripple which ended the four-year legal battle. This decision was influenced by judicial rulings and leadership changes at the SEC, which signaled a shift in regulatory approach.
Read also: We Asked AI to Predict XRP Price If Ripple’s ETF Gets Approved
XRP Price Predictions for Today
Pessimistic Scenario: Based on the current technical indicators, XRP might face continued downward pressure. The weak momentum signals and negative trend indicators suggest the price could potentially drop to around $2.10-$2.20 today.
Optimistic Scenario: Despite the current bearish indicators, the positive SEC lawsuit resolution could provide some underlying support. If market suddenly turns bullish, the XRP price might stabilize around its current price of $2.25 or potentially see a bounce to $2.35-$2.40.
Subscribe to our YouTube channel for daily crypto updates, market insights, and expert analysis.

We recommend eToro
Wide range of assets: cryptocurrencies alongside other investment products such as stocks and ETFs.
Copy trading: allows users to copy the trades of leading traders, for free.
User-friendly: eToro’s web-based platform and mobile app are user-friendly and easy to navigate.