
XRP price is up 3% today, trading at $1.10 as of press time. The catalyst? June CPI inflation fell to 3.5% , below expectations of 3.8%. Core CPI inflation fell to 2.6% , below expectations of 2.8%. Month-over-month CPI inflation fell -0.4% , the biggest monthly drop since May 2020.
We already reported this yesterday, but just to be clear on why the XRP price is up and other altcoins are also up 3-5% today – the market is pricing in rate cuts. Lower inflation means the Fed has room to ease. That is bullish for risk assets, including crypto.
But the bigger story for XRP is not the CPI pump. It is the correction that has been building for a year.
What you'll learn 👉
CasiTrades: The Final Wave Down
CasiTrades, one of the best XRP technical analysts on X, just updated her outlook. She sees the XRP price finishing the correction it spent a year building.
Her tweet laid out the path clearly:
“I’m zoomed into the lower timeframes, and what I see is a potential final 5-wave impulse down into the macro $0.87 support zone. If this structure below plays out, the path is something like this: Sharp wave down now towards $0.93 (w3), relief wave back toward $1.00 (w4), final wave down into the $0.87 macro target (w5).”
She added: “That final move would complete the macro Wave 2 correction and finish off the correction we’ve spent the last year building! The odds still favor one final low into support before the next major trend begins! Don’t blink or you’ll miss this!”
The key claim is not that XRP is entering a bear market. It is that the XRP price is completing the last leg of a correction before a much larger advance.
XRP Chart Analysis: The Elliott Wave Path
The chart CasiTrades shared shows a descending red trendline acting as resistance, with a green support zone around $1.05–$1.08 where XRP is currently sitting. The projected purple Elliott Wave path shows a wave 3 down, a wave 4 relief bounce, and a wave 5 final flush into roughly $0.86–$0.87 , identified as major macro support.
The RSI at the bottom is around 35 – approaching oversold but not yet extremely oversold. That fits a possible final capitulation move.
The projected low aligns with the 1.618 Fibonacci extension, major support, previous structure, and trendline intersection. Those confluences make the target technically reasonable.
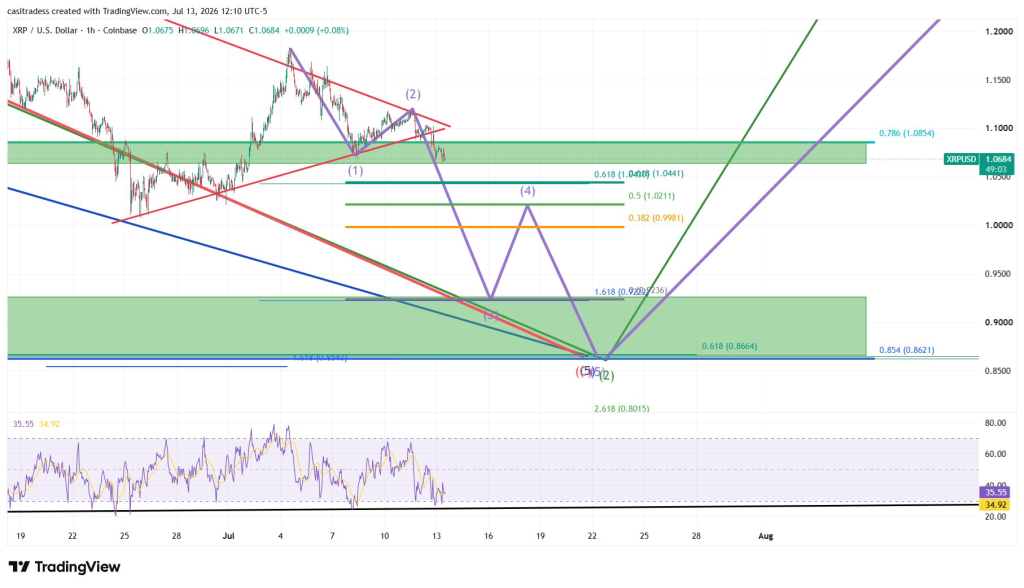
The chart shows successive lower highs, descending resistance, and failed breakout attempts. Momentum has weakened. Price is sitting inside the green demand zone, but there has not yet been a convincing bullish reversal. If this area breaks, the next obvious liquidity sits near $0.92–$0.87, which matches CasiTrades’ projection.
The RSI near 35 suggests sellers still control momentum, but downside may be getting mature. That fits a possible final capitulation move.
What Weakens the Thesis
Elliott Wave is subjective. Another analyst could label this as an ABC correction, an ending diagonal, a triangle, or a completed correction already. Multiple valid counts often exist.
The current green zone around $1.05–$1.08 is significant. If buyers defend it aggressively, the projected wave 5 may never happen. Markets often truncate wave 5, extend wave 3, or invalidate counts with news-driven moves. So the projection should be viewed as one scenario, not a certainty.
The bearish scenario starts weakening if XRP breaks above the descending red trendline, reclaims roughly $1.10, and begins making higher highs. That would suggest the correction may already be complete.
The tweet becomes more convincing if XRP loses the current green support, breaks below about $1.04, accelerates toward $0.98, and fails to reclaim $1.00 on the bounce. That sequence would fit the proposed wave structure.
Read also: Ripple News: Whales Have Abandoned the XRP Ledger
Probability Assessment
To be clear – these are just my projections based on Casi Trades’ analysis and what I follow about XRP.
Based on the chart alone, current support holds and XRP rallies has about a 40% probability. One more flush into $0.87–$0.92 before a larger rally has about a 60% probability.
The bearish case has a slight edge because price remains below a descending resistance line, momentum is weak, and the proposed downside target aligns with multiple support and Fibonacci confluences.
However, the exact Elliott Wave count is the least reliable part of the analysis. The support and resistance structure is more objective than the specific wave labels.
FAQs
Subscribe to our YouTube channel for daily crypto updates, market insights, and expert analysis.