Crypto is red again this week. XRP price is no exception, down almost 10% in the last seven days. The token still holds above $1.00, but just barely. At press time, XRP trades near $1.10.
The broader crypto market is struggling. Bitcoin is in the low $60,000s. Ethereum is below $1,700. Altcoins are getting crushed. XRP is bleeding with the rest of them.
But CasiTrades, one of the best technical analysts in the space, just updated her XRP price outlook again. We decided to cover it because her analysis is probably the best – or at least one of the best – you can find online these days.
What you'll learn 👉
CasiTrades: XRP’s Destination Hasn’t Changed
CasiTrades posted an update on June 23. Her message was clear: the destination hasn’t changed.
XRP is making a new local low and heading back toward the major .786 support at $1.09. The final destination remains $0.87. What is being challenged is the path, not the target.
The lack of a retracement has made the lower timeframe structure less clear. But the macro levels are still the same: $1.09 (.786) and $0.87 (.854).
She sees two possible scenarios:
XRP Price Scenario 1 (Bullish for the short term): The tiny correction was the entire W2. It only reached a .236 retracement, which is unusual. But recent trends have shown W2s getting cut short. If that is the case, XRP could make a sharp move directly toward $0.87. Because W3 would land at the major support, there is a chance the final 5th wave fails if liquidity is cleared on the first test.
XRP Price Scenario 2 (More typical): XRP finds support again at $1.09, then retraces into a more typical W2. That would place retracement near $1.18, which mirrors recent price action. From there, a larger W3 would target $0.87. Again, there is a chance of the failed 5th if liquidity is picked up with the first test.
Her key point: “Either way, we’re tracking subwaves, not making trading decisions from them. The macro levels remain $1.09 (.786) and $0.87 (.854). Those are the only levels that matter! We’re getting very close to the end of this correction!!”
Chart Analysis: XRP at Critical Support
The attached TradingView chart from CasiTrades shows XRP/USD on the 4‑hour timeframe.
Key observations:
The .786 support at $1.09: This is the most important level on the chart. Price is approaching it now. The annotation on the chart marks it clearly at $1.0854. This level has held before and is now being tested again.
The .854 target at $0.8621: The lower extension target that CasiTrades has been tracking for months. This is the final destination of the correction.
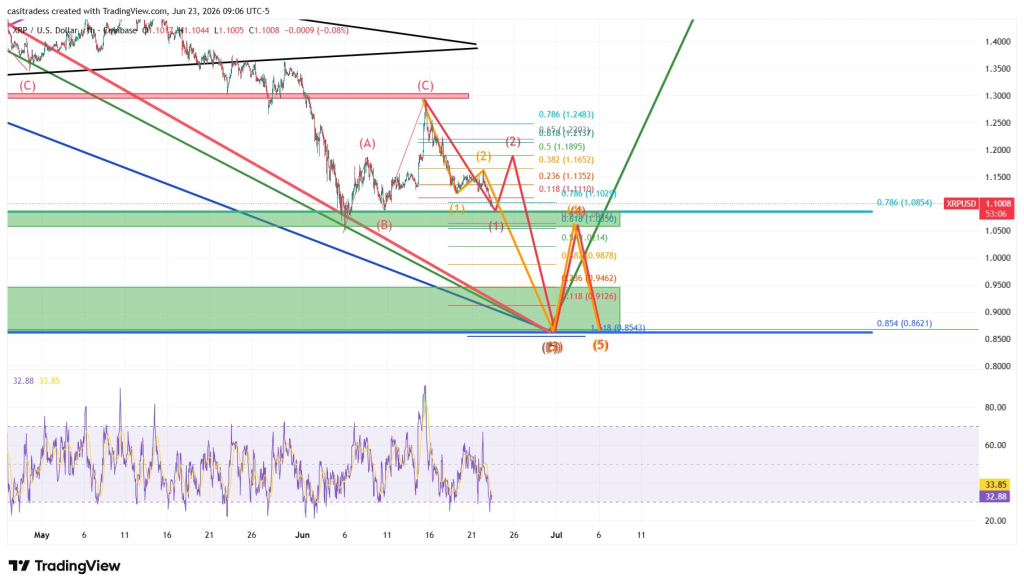
Fibonacci levels: The chart is marked with multiple Fibonacci levels. The .618 at $1.2393, the .5 at $1.1895, the .382 at $1.1652, and the .236 at $1.1352. These show the retracement levels that would define a typical W2. Price is currently below all of them, confirming the bearish momentum.
The RSI at the bottom: The RSI on the 4‑hour chart reads 33.85. That is approaching oversold territory. A reading below 30 would indicate selling pressure is exhausted. The previous reading of 32.88 shows that momentum is still bearish but not extreme.
Lower highs and lower lows: The XRP price action since mid‑June shows a clear downtrend. Each rally has been sold into. Each low has been lower than the previous one. That is the structure of a wave 3 down.
The conclusion from the chart: XRP is approaching the .786 support at $1.09. If that level holds, the W2 retracement scenario (Scenario 2) is likely. If it breaks sharply, the direct move to $0.87 (Scenario 1) is in play.
Our Take on the XRP Price
CasiTrades’ analysis is consistent and disciplined. She has been tracking the $0.87 target for months. The levels have not changed. The path is the only variable.
The fact that she sees two scenarios means she is not forcing a prediction. She is letting the market reveal itself. That is what good analysts do.
The $1.09 level is now the line in the sand. If the XRP price holds it, we could see a bounce toward $1.18 before the final leg down. If it breaks, the move to $0.87 could happen faster than expected.
For traders, the risk‑reward is improving. The correction is nearing its end. The final low, whether at $1.09 or $0.87, is getting closer.
FAQs
Subscribe to our YouTube channel for daily crypto updates, market insights, and expert analysis.