

Silver price and gold price have both endured a dramatic journey during 2026. Each metal reached a record high on January 29 before losing a large part of its value during the following months. Their similar direction, however, hides an important difference that could decide which metal performs better before December.
Silver carries greater risk because its price usually moves faster than gold in either direction. That same volatility could become an advantage if industrial demand remains strong, interest rates fall, and physical supply stays limited. Financial Crux believes those factors could give silver price an opportunity to outperform gold price before the year ends.
What you'll learn 👉
Silver Price Is Trying to Recover After Its Historic January Collapse
Silver price reached an all time high of $120.45 per ounce on January 29, 2026. That remarkable rally ended only 1 day later when the metal fell more than 17% from about $120 to $95.
The January 30 decline became silver’s largest single session selloff in 13 years. Aggressive speculation had driven the metal to record territory, but reduced market liquidity made the reversal more severe.
Silver continued losing value throughout spring as earlier buyers reduced their exposure. June and July brought some stability, and silver price eventually found support between $55 and $58.
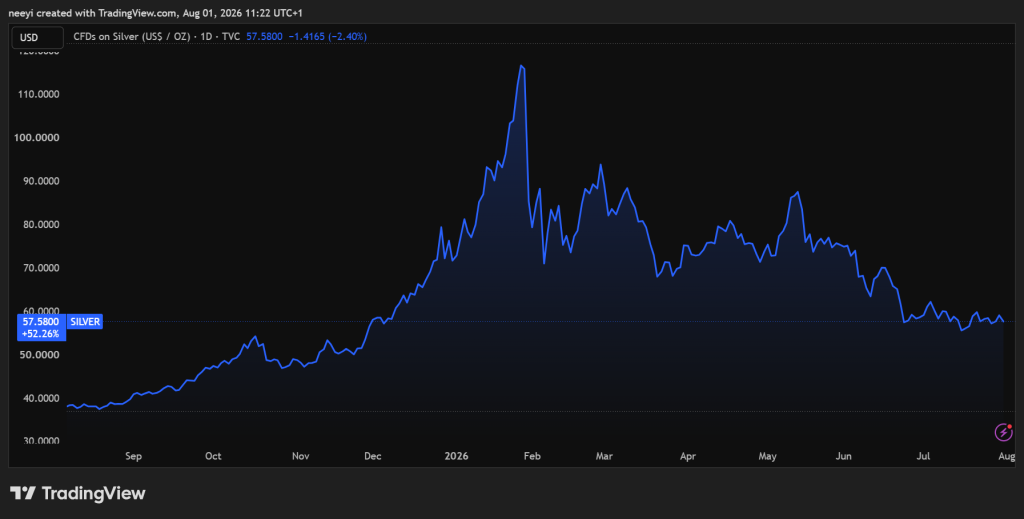
A look at the silver chart shows that this area remains important. The metal is still below several short term moving averages, which means buyers have not confirmed a lasting recovery. Continued support around $55 could provide the base for another attempt toward higher levels later this year.
Gold Price Remains Close to an Important Support Zone
Gold price followed a similar path during the January metals rally. The metal reached an all time high of $5,595.42 per ounce on January 29 before dropping roughly 8% during the following session.
The decline briefly pushed gold price toward $4,941. Gold later recovered enough to finish that volatile week above $5,180, although the wider correction continued during spring.
Expectations of tighter Federal Reserve policy and a stronger US dollar placed further pressure on gold. The metal broke below its $4,170 support during late March and temporarily moved under $4,000 in June.
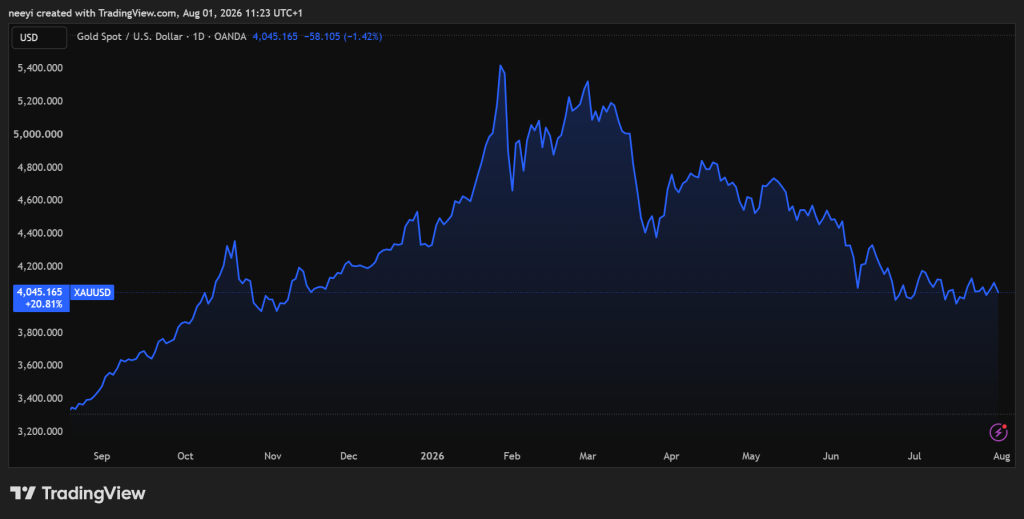
Gold currently trades near $4,044.47 per ounce, where it is testing a crucial horizontal support area. Upcoming central bank decisions could determine whether gold defends this region or records another decline.
Silver has fallen much further from its January record, but that larger correction could leave more room for recovery. Gold provides greater stability, although its lower volatility may limit its percentage performance during a broad metals rebound.
History Shows Silver Can Produce Bigger Percentage Returns Than Gold
Silver has outperformed gold during several major periods. Strong industrial consumption, limited supply, and speculative demand usually played important roles during those rallies.
The Hunt Brothers era offers one of the clearest examples. Silver climbed from about $6 during 1979 to nearly $50 in 1980. Its percentage return exceeded gold’s advance and pushed the gold to silver ratio toward a historic low near 15.
Another major period came after the global financial crisis. Silver reached roughly $49 per ounce during April 2011 after climbing more than 1,100% from its 1999 level. Gold gained roughly 660% across the comparable period.
Green technology demand created similar conditions during 2025 and early 2026. Solar panels, electronics, and electric vehicles required growing amounts of silver. That demand helped the metal move beyond $60 and eventually reach triple digits.
These examples reveal a recurring pattern. Silver can rise faster when investment demand meets strong industrial consumption, although its corrections are often more severe.
Financial Crux Identifies Four Factors That Could Favor Silver Price
Financial Crux explained on X that silver’s possible advantage depends on several measurable conditions. The channel focused on the metal’s supply deficit, industrial use, interest rate sensitivity, and its valuation relative to gold.
Global silver consumption has exceeded mine production for 6 consecutive years. Financial Crux estimates that the 2026 deficit could reach between 45 million and 70 million ounces.
Supply cannot respond quickly because roughly 70% of silver comes from copper, zinc, or lead mines. Higher silver prices do not automatically produce more output because production depends heavily on decisions made in those separate mining industries.
Read Also: Gold Price Prediction as Fed Rate Bets Set Up a Major Tailwind for Metals
Industrial demand creates another possible advantage. Silver is needed across several fast growing sectors:
- Solar panels require silver for electrical conductivity.
- Electric vehicles use silver across numerous electronic components.
- Smartphones and medical equipment depend on the metal.
- Artificial intelligence infrastructure may increase demand for advanced electronics.
Manufacturers continue reducing the amount of silver needed in each product. Total consumption can still increase when overall production grows faster than those reductions.
Gold does not have the same industrial demand base. Central banks, jewellery buyers, and investors primarily hold gold as protection against economic and currency uncertainty. Silver has monetary value, but its use across manufacturing gives it an additional source of demand.
Silver Could Outperform Gold By The End Of The Year! Here's Why pic.twitter.com/YDET6D1XZ7
— Financial Crux (@FinancialCrux) July 31, 2026
Interest Rates and the Gold to Silver Ratio Could Decide the Outcome
Financial Crux believes lower real interest rates could help both metals. Silver may record the larger percentage move because it normally reacts more forcefully to easier monetary conditions and a weaker dollar.
The gold to silver ratio provides another useful measure. This ratio shows how many ounces of silver are needed to purchase 1 ounce of gold. A falling ratio means silver is performing better, and a rising ratio means gold is taking the lead.
Financial Crux noted that the ratio currently stands near 70. A sustained move below 65 could confirm renewed strength for silver. A climb above 75 would place gold back in the stronger position.
Industrial figures will matter as well. Stronger solar demand, higher electric vehicle production, or evidence of lower physical inventories could support silver price. Weak manufacturing activity could reduce that support and allow gold to perform better.
Read Also: Here’s Why Gold and Silver Sold Off Today (And Why That Could Reverse Soon)
Silver Still Faces Risks That Could Keep Gold Ahead
Silver’s connection to industry creates both opportunity and vulnerability. A global economic slowdown could reduce factory output and weaken demand for electronics, vehicles, and solar equipment.
Gold remains less dependent on economic growth. Central banks continue to use the metal as protection against inflation, geopolitical conflict, and currency instability. That established role could favor gold if global uncertainty increases.
Recent volatility presents another concern. Silver’s fall from $120.45 to the current $55 to $58 area shows how quickly its direction can change. Gold has declined as well, although its correction has been smaller in percentage terms.
Silver could outperform gold before the end of 2026 if supply remains tight, industrial consumption stays firm, and interest rates become more supportive. A ratio below 65 would provide stronger evidence that silver is taking control.
Subscribe to our YouTube channel for daily crypto updates, market insights, and expert analysis.







