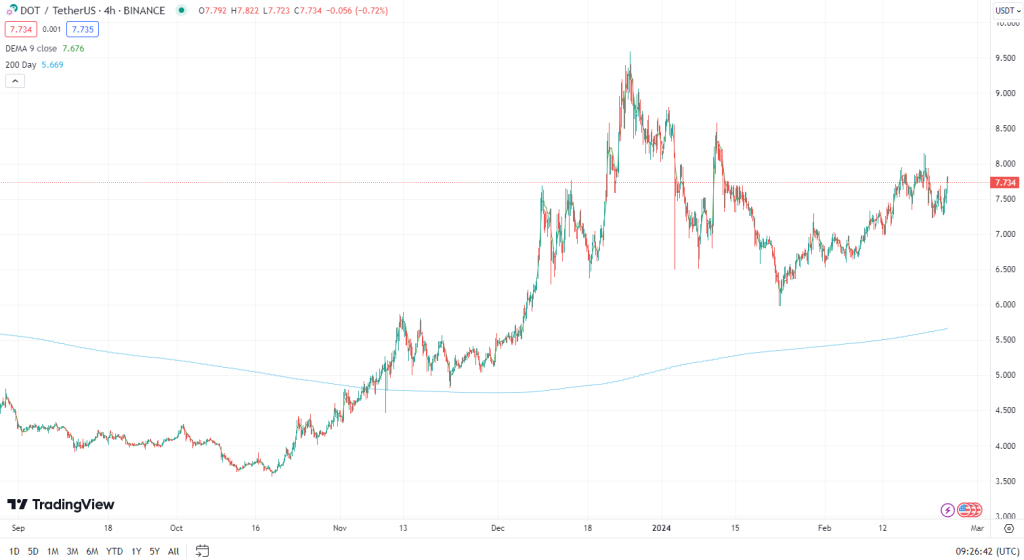
The crypto market has been relatively calm over the weekend but one altcoin did see a decent price pump – Polkadot (DOT). DOT’s price is up 6% today, making it the second best performing altcoin among the top 15 cryptocurrencies by market cap, after Uniswap. DOT is currently trading around $7.7, slightly down from its 2022 yearly high of around $8.16 set in mid-January.
While the price bump is certainly positive, not all indicators are bullish for Polkadot. The Relative Strength Index (RSI) on the daily chart reads 56 which shows the market is not overbought. The RSI is a technical momentum indicator that measures the magnitude of recent price changes to evaluate overbought or oversold conditions. RSI values range from 0 to 100 with readings above 70 indicating an overbought state and readings below 30 signaling an oversold state. At 56, the RSI suggests DOT’s still has some room to grow until becoming overbought and face a potential correction.

Another key indicator is the 200-day moving average, which currently sits at $5.56 for DOT. A moving average (MA) is a trend-following or smoothing technique used to represent price data over a period of time. The 200-day MA is one of the most popular long-term indicators as it filters out daily price noise and identifies major trends. When the price is above the 200-day MA line, it indicates a long-term uptrend. While DOT’s price is above this line, signalling an ongoing bull market, the small premium suggests the rally may lose steam going forward.
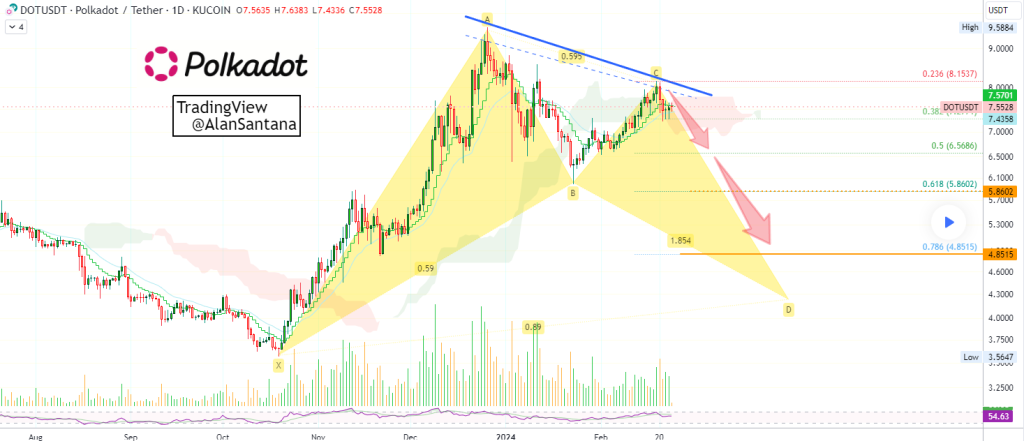
Renowned TradingView analyst AlanSantana, who has over 140k followers, outlined a “bearish harmonic pattern” emerging on the DOT/USD chart. As Santana noted, “The lower high is now in place. It came in 19-Feb. The current candle has an upper shadow and is currently trading at the session low below EMA10. Trading volume continues to decline since 9-Dec. Bearish harmonic pattern. Polkadot (DOTUSDT), has been moving with a bearish bias for two months.”

Santana explained that additional bearish signals include the declining trading volume, upper candle wick rejection at the 10-day EMA resistance, and the bearish harmonic pattern formation over the past two months. He believes DOT’s price correlation with large altcoins and bitcoin also points to further downside. Santana has identified the 0.786 and 0.618 Fibonacci retracement levels between $4.85-$5.86 as the next downside targets based on the prior bullish wave.
Notcoin airdrop on Telegram made millions to people. Don’t miss out on the next TG airdrop by the same team – Dogs on Ton!
Show more +While the short term price action shows DOT in the green, various technical indicators paint an overall bearish picture according to Santana’s analysis. The emerging bearish patterns and falling volume could see Polkadot retest lower support levels in the weeks ahead.
You may also be interested in:
- Why is XAI Token Surging? Analyst Says ‘Consolidation Breakout Retested’ – Here’s His Outlook
- Starkent (STRK) and Filecoin (FIL) Prices Pumping – Here’s Why
- Meet The Viral Cryptos – Bitcoin Minetrix and BlockDAG (BDAG) Raise Millions In Their Ongoing Presales While Jupiter Surges
We recommend eToro
Wide range of assets: cryptocurrencies alongside other investment products such as stocks and ETFs.
Copy trading: allows users to copy the trades of leading traders, for free.
User-friendly: eToro’s web-based platform and mobile app are user-friendly and easy to navigate.
eToro offers staking for certain popular cryptocurrencies like ETH, ADA, XTZ etc.


