

Hyperliquid has lost a large part of its recent advance after Crypto Patel warned that buying HYPE above $70 carried considerable risk. The token later dropped from its $77 high to around $53, which produced a decline of roughly 31%.
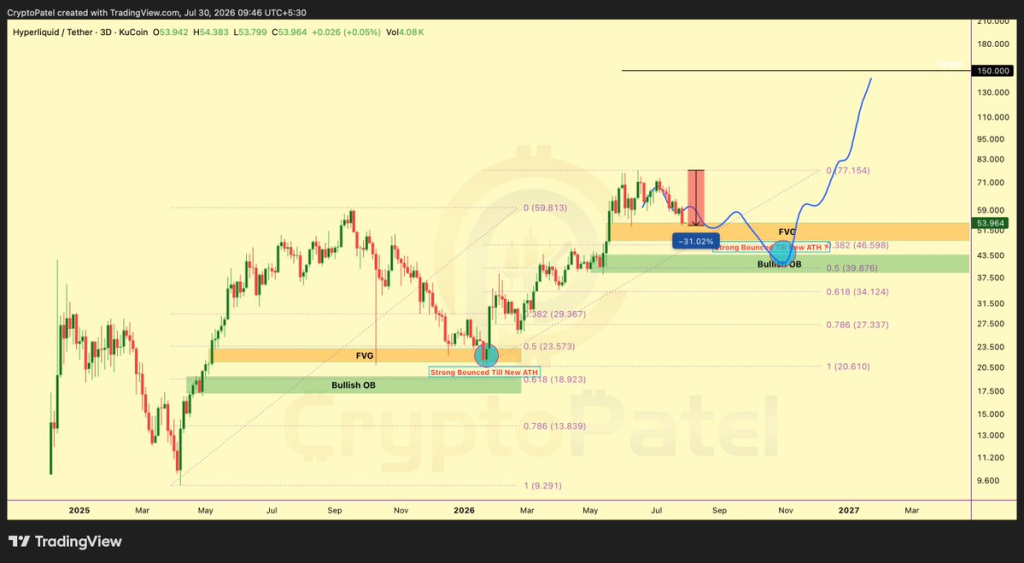
That prediction has already played out, but Crypto Patel does not believe the correction is complete. His chart presents a deeper HYPE price target and maps out what could follow if buyers defend the expected demand zone.
Daily indicators from Investing.com support the bearish case. All 5 indicators currently carry sell readings, which leaves room for Hyperliquid price to move below $50 before a stronger recovery attempt begins.
Crypto Patel warned several days ago that HYPE had entered a high risk region after moving above $70. Hyperliquid price later reached approximately $77 before sellers took control and pushed it toward $53.
The decline from $77 represents a drop of nearly 31%, which matches the correction the analyst expected. Crypto Patel explained that avoiding new positions above $70 would have protected capital, even without opening a short position.
His main argument was that buying after an extended rise can leave recent buyers exposed to a deep correction. HYPE had already climbed considerably before reaching $77, which reduced the appeal of buying near the top of that advance.
Hyperliquid price now trades near $53, but Crypto Patel still expects another move lower. His next target rests within a Fibonacci retracement area between $40 and $34.
What you'll learn 👉
Crypto Patel’s Chart Maps a Deeper HYPE Price Correction
A look at Crypto Patel’s HYPE chart shows the token returning toward a large demand area created during its previous advance. The projected path first takes the price through an imbalance region near the upper $40 area before testing deeper support.
The chart places the 0.5 Fibonacci retracement level near $39.07. Another major level appears at approximately $34.12, which represents the 0.618 Fibonacci retracement.
Those levels closely match Crypto Patel’s stated target between $40 and $34. This region could determine whether HYPE forms a base or extends its decline toward lower support.
The chart marks a bullish order block within this broad demand zone. Such an area represents a previous region where strong buying helped price move higher. A return to that region could provide buyers with another chance to defend Hyperliquid price.
Crypto Patel’s projected path includes some temporary rebounds before HYPE reaches the main demand zone. Price could therefore move up and down during the correction instead of falling directly toward $40.
The $40 to $34 Demand Zone Could Decide the Next Major Move
Crypto Patel plans to watch the $40 to $34 region for a possible long term accumulation opportunity. However, the chart requires confirmation from buyers before its bullish projection becomes stronger.
A drop from the current HYPE price near $53 to $40 would equal a further decline of approximately 25%. Movement toward $34 would extend that decline to roughly 36%.
The $39.07 level could provide the first major test because it marks the 0.5 Fibonacci retracement. Strong demand near this this price could help HYPE begin another recovery attempt.
Failure to defend $39 would bring the 0.618 level near $34.12 into focus. The chart treats this lower area as an important part of the bullish order block and demand region.
Deeper Fibonacci support appears near $27.34 and $20.61. Those levels are not Crypto Patel’s primary targets, but they could become relevant if HYPE breaks below the $34 area and fails to recover quickly.
A Successful Defense Could Reopen the Path Toward $100 to $150
Crypto Patel remains optimistic about Hyperliquid’s broader potential despite his bearish near term forecast. His chart projects a recovery from the $40 to $34 region if buyers defend that demand zone.
The first recovery challenge would involve reclaiming the fair value gap above the demand area. HYPE would then need to move back above the former high region near $70 to confirm renewed strength.
Crypto Patel’s projected path eventually moves beyond the previous high and continues toward $100 to $150. The chart marks $150 as the larger bullish target after a possible return to record territory.
That outcome remains conditional because HYPE must first complete the correction and protect the marked support region. A sustained break below $34 would weaken the projected recovery and increase the risk of lower Fibonacci levels becoming active.
Daily HYPE Indicators From Investing.com Remain Bearish
Daily technical indicators from Investing.com carry sell readings across all 5 measurements. Their combined message supports the possibility that HYPE price could move closer to Crypto Patel’s lower target.
| Indicator | Value | Action |
|---|---|---|
| RSI (14) | 33.855 | Sell |
| Stochastic (9,6) | 29.41 | Sell |
| MACD (12,26) | -2.62 | Sell |
| Ultimate Oscillator | 39.658 | Sell |
| Bull/Bear Power (13) | -8.276 | Sell |
The RSI reading of 33.855 shows weak momentum, although HYPE remains above the traditional oversold level of 30.
The Stochastic reading of 29.41 shows that buyers have not regained enough strength to reverse the decline.
The negative MACD reading confirms that the daily Hyperliquid price trend remains under pressure.
Read Also: Crypto Price Prediction for Today, July 30: Bitcoin (BTC), XRP, and Injective (INJ)
The Ultimate Oscillator reading of 39.658 shows weak demand across the periods measured by the indicator.
The negative Bull/Bear Power reading confirms that sellers still control the current HYPE price direction.
Crypto Patel’s initial warning proved accurate after HYPE dropped nearly 31% from its $77 high. His remaining forecast calls for a deeper correction toward the Fibonacci demand zone between $40 and $34.
The chart gives that region added importance because it contains the 0.5 and 0.618 retracement levels alongside a bullish order block. Daily indicators from Investing.com remain bearish, which means another decline cannot be dismissed.
FAQs
Subscribe to our YouTube channel for daily crypto updates, market insights, and expert analysis.






