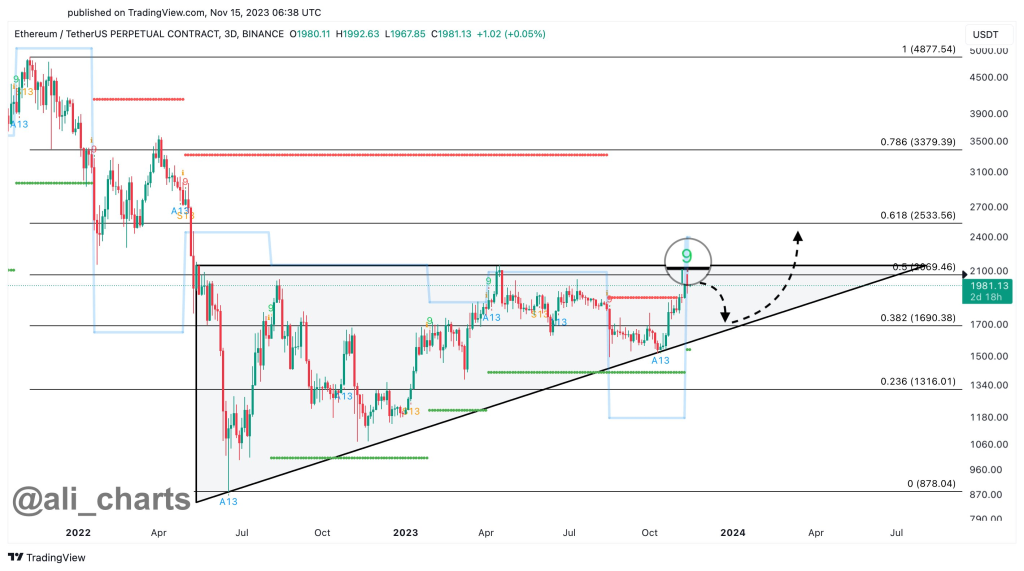
The TD Sequential indicator is currently flagging a potential sell signal on ETH’s 3-day chart as the asset tests stiff resistance between $2,000 and $2,150, according to popular crypto analyst Ali on X (Twitter).
This resistance zone aligns with the x-axis of an ascending triangle pattern that Ethereum has formed on higher timeframes. Ascending triangle patterns are typically continuation patterns, suggesting the previous uptrend could resume after a consolidation breakout above the pattern’s horizontal resistance.
However, Ali cautions that a rejection here could lead ETH to drop back toward the triangle’s hypotenuse, currently around $1,700. This would provide an opportunity for additional consolidation and a springboard for an eventual breakout above $2,150.
At the time of writing on Wednesday, November 15, Ethereum is trading around $1,983, down 4% over the last 24 hours. The recent pullback comes as ETH tested but failed to break above the key $2,150 level.
The relative strength index (RSI) on Ethereum’s daily chart is currently reading around 60. An RSI above 50 signals bullish momentum, but below 70 indicates the asset is not yet overbought. This leaves room for ETH to continue higher if it can close decisively above the $2,150 resistance.
In summary, Ethereum faces a potential bearish signal according to the TD Sequential indicator. However, a sustained 3-day close above $2,150 could invalidate the sell setup and open the doors for continued upside. Key levels to watch will be the triangle resistance at $2,150 and support around $1,700.

We recommend eToro
Wide range of assets: cryptocurrencies alongside other investment products such as stocks and ETFs.
Copy trading: allows users to copy the trades of leading traders, for free.
User-friendly: eToro’s web-based platform and mobile app are user-friendly and easy to navigate.