Trading cryptocurrencies is a peculiar activity, one that can earn you a lot of money if you know what you are doing. Basic advice that anyone gives to a trader is to remove emotions from trading. Therefore every shitcoin, no matter what you thought of its developers/community/awful ticker should be seen as an opportunity to profit on. The other equally as important thing that you will need to master are the trading patterns.
Traders who have years of experience swear in one thing: market movements can be predicted. The chart of an asset can show you patterns and movements that more often than not lead to certain outcomes, which are either price break-outs or downtrends. This is what we call technical analysis and people who trade without implementing at least some elements of it are basically throwing their money onto a craps table from 10 ft. away, while blindfolded.
The predictions a trader makes are based on the psychology of the markets, as every chart is basically a reflection of the general market sentiment. Supply/demand relationship and what the market feels about where the price is headed next can be spotted with relative ease simply by observing said chart. Granted, this is where the initial rule comes into play: never become emotional. Inexperienced traders tend to see patterns that aren’t actually there, either as a result of wishful thinking and becoming too attached to their bags.
It is also important to remember that charting isn’t everything. Each trade should be done AFTER carefully examining the fundamental elements of the coin you are investing in. You will need to consider that said elements might make your patterns and technical analysis not pan out as planned.
That being said, there are several patterns that you will often come across while trading crypto (or any other asset for that matter). Let’s take a look at some of them:
Head and shoulders
This pattern is considered as the most reliable one out there, as its success rate tends to be over 75%. It’s a typical reversal pattern, signifying that a previous trend is about to change. H&S pattern will have one left shoulder, one head and one right shoulder. The pattern can be a Top one or a Bottom one.
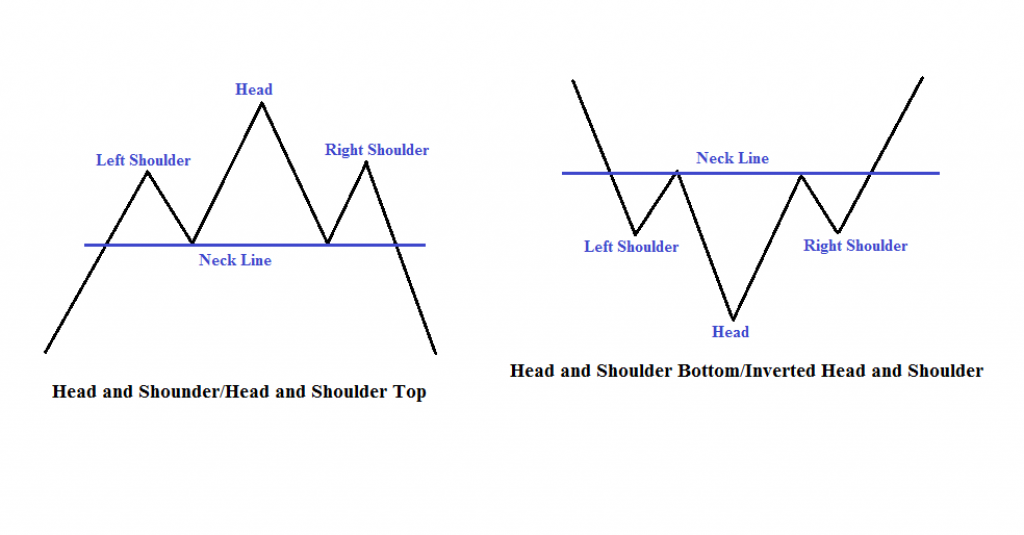
The left shoulders peak is reached either with a prolonged raise of a fall that’s accompanied by high volume. The shoulder is completed with a short but strong reversal in the other direction which bounces off the neckline. The price then either rallies upwards/falls downwards with stronger intensity to reach the peak of the head; this is followed by a reversed movement with lower volume which will again bounce off the neckline. Finally, the right shoulder will be formed when the price moves strongly in opposite direction from the last move and then reverses its movement at the peak of the shoulder (which should be at a similar level to where left shoulder peak was). Depending on where the right shoulder formation is completed (rising or falling), a reversal in the opposite direction is expected soon after. Right shoulder needs to move past the neckline to confirm the pattern and the upcoming reversal.
Cup and handle
This pattern tends to be bullish in nature, as it regularly leads to price increases. It usually consists of a drop in the price and a rise back up to the original value, followed a smaller drop and a rise past the previous peak.
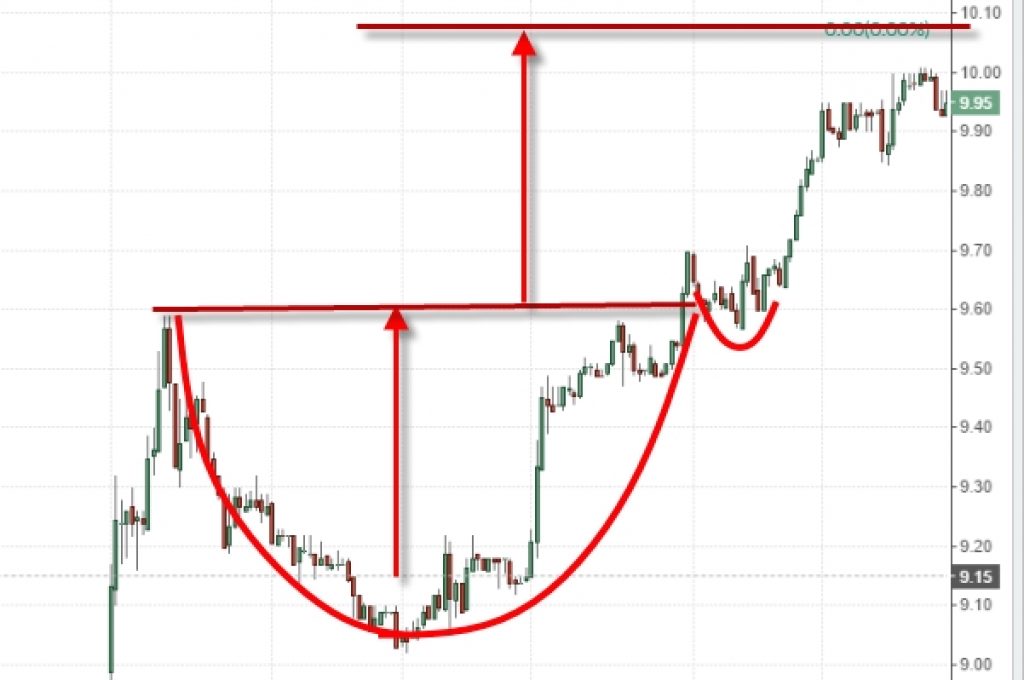
The cup part should be more rounded than not and the prices at the top of the formation should be at around the same levels. Trade volume should decrease along with the price during the cup and should increase rapidly near the end of the handle when the price begins to rise. Sometimes you can also spot an inverse cup & handle pattern which indicates a strong drop in price is coming.
Double top/bottom
This formation is often seen at the ends of bull markets. It’s made out of two consecutive peaks reaching approximately the same level (with equally leveled bottoms as well) that are followed by a steep drop in price.
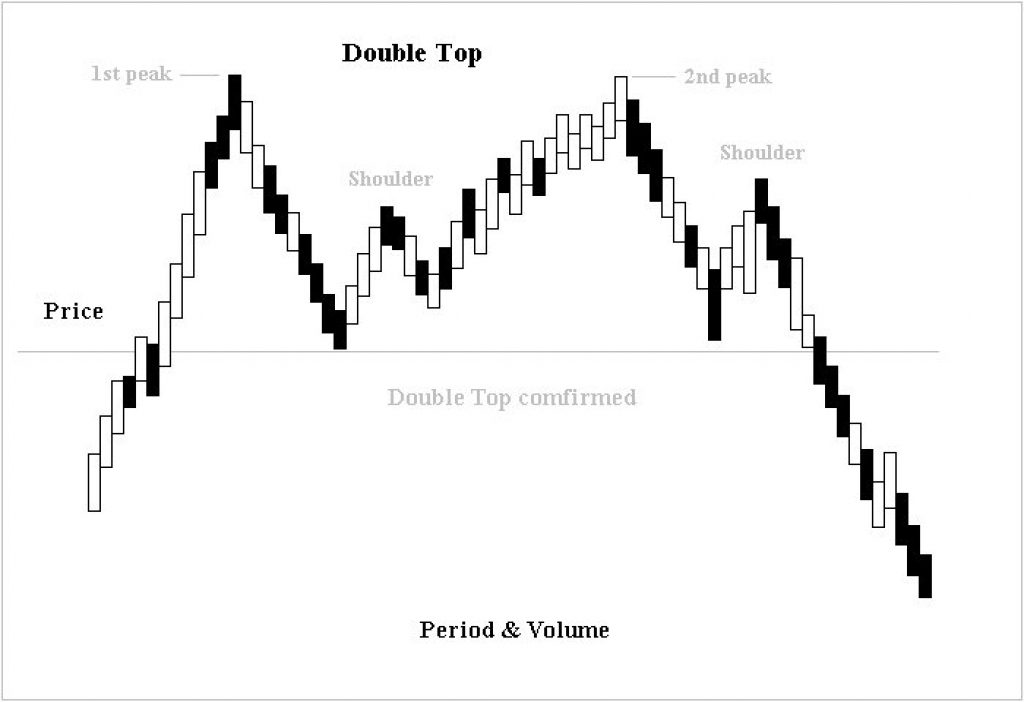
Source: https://en.wikipedia.org/w/index.php?curid=28360416
The space between the two peaks is called a valley. The lows form the neckline of the pattern and once the price drops below this line, the pattern is confirmed. The time between the two peaks is also a determining factor for the existence of a double top pattern. If the tops appear at the same level but are very close in time, then the probability is high that they are part of the consolidation and the trend will resume. Volume is also important to observe. Price should reach the first peak on increased volume then fall down the valley with low volume. Another attempt on the rally up to the second peak should be on a lower volume. Inverse pattern to this is called the double bottom and it signals a bullish breakout is coming.
Flags and pennants
Patterns well known as signals of trend continuation, flags and pennants are among most often used ones in the world in technical analysis.
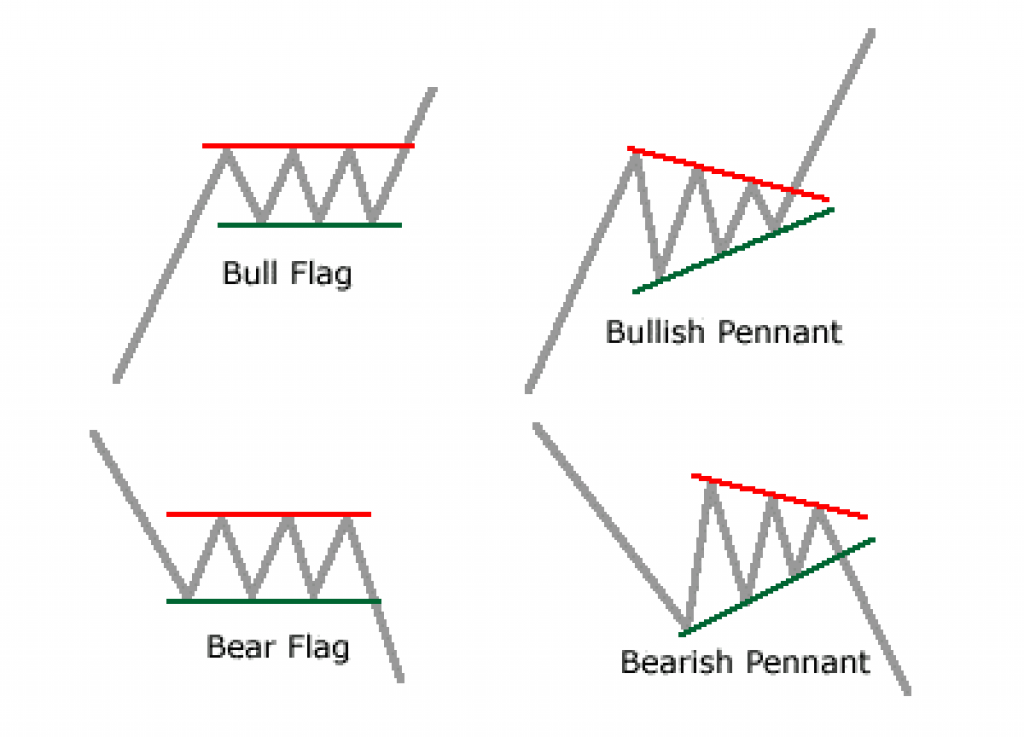
The flag pattern is captured by two parallel lines. The pennant pattern is identical to the flag pattern in its setup and implications; the only difference is that the consolidation phase of a pennant pattern is characterized by converging trend lines.The pole of the flag/pennant is represented by the line of the previous market trend. Sometimes called a wedge, the pattern indicates that the market is gathering momentum to continue the currently active movement, whether that’s a rally upwards or a drop downwards. It’s a natural part of a trend as those who entered at the start of it are taking profits while new traders are entering the market and taking positions for the next run-up in price.