
Solana is up 2.90% to $98.46 in 24 hours, outperforming a flat broader market, primarily driven by strong institutional demand through spot ETFs and a breakout above the key $100 level.
US spot Solana ETFs attracted $33.49 million on August 24, their strongest single-day inflow since December 2025, lifting cumulative net inflows to about $1.22 billion.
Also, Solana recorded 4.2 billion on-chain transactions in July, up 13.5% from June and 91% from December 2025. With network activity reaching record levels and the Agave 4.2 upgrade cutting storage costs by 90%, the SOL price now has both market and fundamental catalysts to watch.
What you'll learn 👉
Solana’s 4.2 Billion Transactions Show Network Activity Is Back
The latest Solana data gives the SOL price rally a stronger fundamental backdrop. Solana processed 4.2 billion on-chain transactions in July, marking a record for the network. That was an increase of 13.5% from June and 2 billion more transactions than December 2025, representing a 91% increase.
BREAKING: Total onchain transaction count on Solana hit a record 4.2 billion in July, up +13.5% month-over-month.
— The Kobeissi Letter (@KobeissiLetter) August 25, 2026
This marks an increase of 2 billion transactions compared to December 2025, or +91%.
The surge in activity comes as Solana, $SOL, rallied +40% in 8 days to its… pic.twitter.com/79JuX0mAUu
The activity is also connected to the growth of tokenized assets. The real-world asset market on Solana has grown above $38 billion, and Jupiter now accounts for about 71% of DEX aggregator volume on the network. This matters for the Solana price because higher activity creates more demand for the infrastructure that powers transactions, trading and applications.
Institutional flows are adding another measurable demand source. Solana ETFs brought in $33.49 million on August 24, with Bitwise’s BSOL accounting for about $25 million. ETF trading volume also reached $166.83 million that day.
Agave 4.2 Gives the SOL Price Another Fundamental Catalyst
Solana’s Agave 4.2 upgrade could make the network cheaper and more capable for developers. SIMD-0437 reduces the storage-rent requirement by 90%, taking the rent-exempt deposit for a standard SPL token account from about $0.159 to approximately $0.0159.
That difference becomes important for applications that need thousands or millions of accounts. Order-book exchanges, games and tokenization platforms can maintain on-chain state with much less capital locked into account deposits.
Agave 4.2 also raises the maximum transaction size from 1,232 bytes to 4,096 bytes. The upgrade is designed to reduce slot times from 400 milliseconds toward 200 milliseconds as the staged activation proceeds.
The trade-off is that cheaper storage can encourage more state growth, increasing demands on validators. That makes account growth, validator participation and network performance important metrics to watch as more features become active.
Here’s What the Solana Chart Is Showing
We had a look at the chart, and the technical structure has improved considerably from the June low near $62. The SOL price spent weeks trading below $84 before breaking above that area in July. That $84 level is now the first major support zone on the chart.
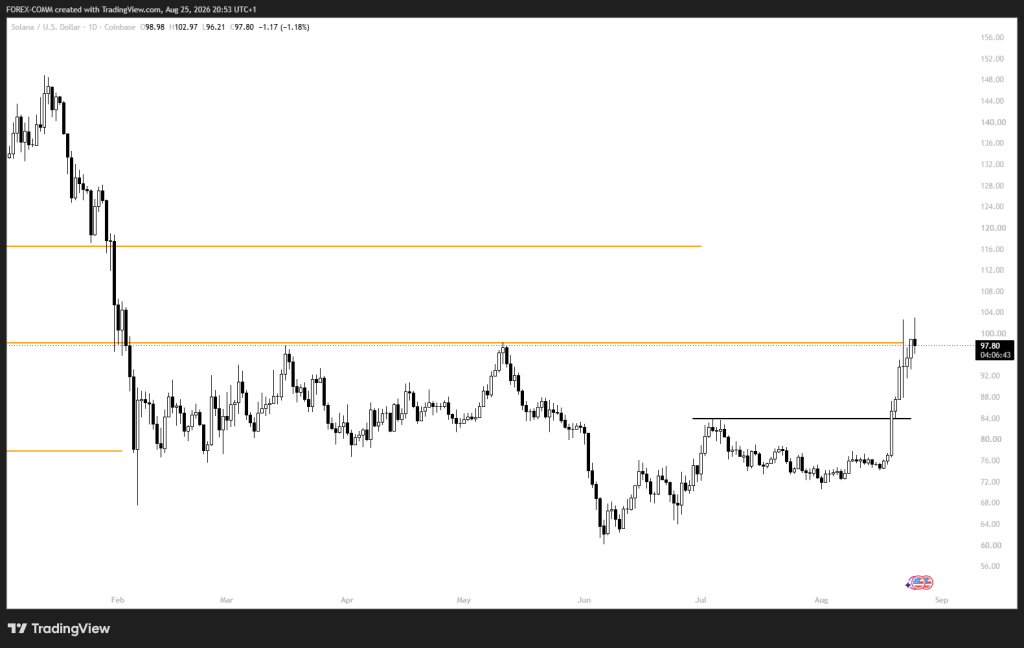
The latest rally pushed SOL through $90 and into the $98-$100 region. The chart shows resistance around $100, and the current candle is testing that zone after reaching an intraday high near $103. If buyers establish a daily close above $100, the next major resistance is around $116.50.
The $116.50 level matters because it was a major support and resistance area during the earlier decline. A successful move through $100 would therefore give the SOL price a clear technical target above $116.
If the breakout fails, $84 becomes the key level to monitor. Below it, the chart points toward the $78 area, followed by the June base around $62-$64.
Related Solana News: We Asked 3 AI Models What $10,000 in Solana (SOL) Could Be Worth by 2030
Where Could the SOL Price Go Next?
The bullish path starts with SOL holding the $97.50-$100 area and reclaiming $103. A daily close above $103 would put $116.50 into view. From $98.46, a move to $116.50 would represent about 18% upside.
The neutral path would see SOL struggle around $100-$103 and return toward $92-$94. If buyers defend that zone, the SOL price could consolidate before making another attempt at $103 and then $116.50.
The bearish path begins if SOL loses $97.50 and fails to recover the level. A move below $94 would expose the $84 support zone, and a break there could send the SOL price toward $78. A deeper loss of $78 would reopen the June range near $62-$64.
For now, the data gives SOL two clear catalysts: record network activity and strong institutional ETF demand. The technical picture adds another test, with $100-$103 acting as the immediate barrier and $84 as the key support beneath the breakout.
Frequently Asked Questions
Subscribe to our YouTube channel for daily crypto updates, market insights, and expert analysis.