Silver is at $68.07 an ounce right now. It tried to break past $70 earlier but couldn’t hold, so it pulled back. Even with today’s drop, it’s still up over 17% this month after bouncing from around $55.
So why the dip? The dollar is stronger, bond yields are up, and everyone’s watching the calendar for what comes next, especially with Fed chair Kevin Warsh set to speak at Jackson Hole.
On August 25, the silver price hit $69.94, then slid back to about $68.20. That puts $70 firmly in the way as resistance. But price is still hanging above the mid-60s, so the real question is: is this just a normal cooldown before another push up, or could it turn into something deeper that breaks the whole bullish trend pattern?
What you'll learn 👉
Silver Completes a Five-Wave Advance
MCO Global’s latest silver analysis is based on Elliott Wave theory, and the key point is that the advance from the July low can be counted as a completed five-wave impulse.
On the chart, the move is labelled across waves 1 through 5, with the final leg reaching the area around $70. This matters because a completed five-wave advance is normally followed by a corrective phase before the next directional move develops.
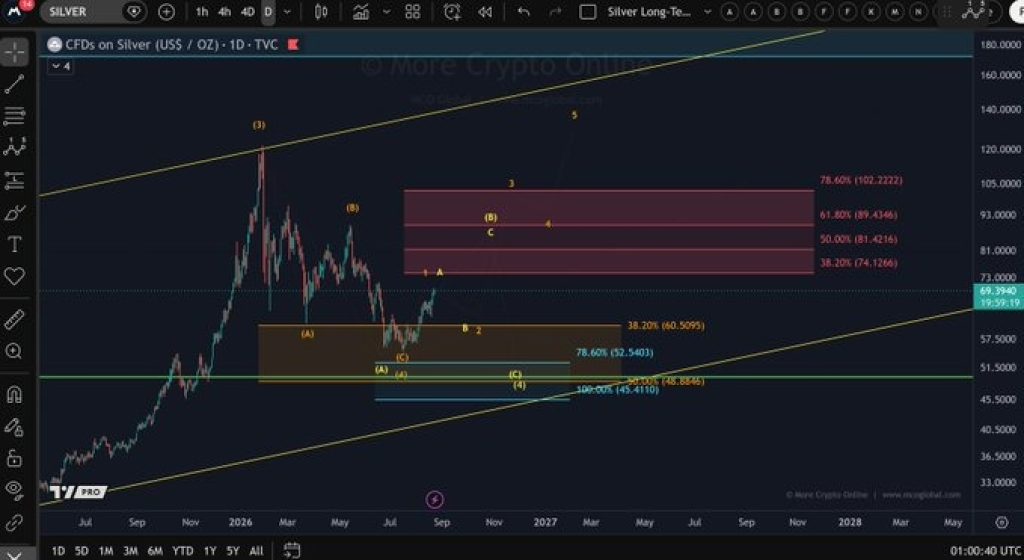
The analyst’s bullish case depends on what happens next. The preferred scenario is a three-wave pullback, commonly labelled A-B-C, that produces a higher low. In practical terms, silver does not need to keep climbing immediately.
A controlled retracement that holds above the important support zones would leave the orange bullish count intact and create room for another five-wave advance.
The chart gives several levels to monitor during that correction. The first notable retracement area is around $60.51, marked by the 38.2% Fibonacci level. Below that, the silver chart places another key Fibonacci zone near $52.54, with deeper support around $51.50 and $45.41. That makes the reaction from the $68-$70 region more important than the next single daily candle.
Why the Next Pullback Could Be Crucial
Silver’s move toward $70 has already produced a sizeable monthly gain. TradingKey puts the metal’s August advance at more than 18%, with the August 25 session reaching $69.94 before price retreated. That means some cooling near resistance would not automatically damage the bullish structure.
The key is where buyers return. A pullback toward $60.51 would represent roughly a 10.8% decline from $67.82, but it would still leave silver above the chart’s deeper support cluster.
A move below $52.54 would be much more damaging because it would erase a large portion of the July-August advance and raise the probability that the move from the July low was corrective rather than impulsive.
There is also a macro reason for caution. The U.S. 10-year Treasury yield was around 4.68% on August 25, and the dollar remained near 99 on the DXY, creating headwinds for non-yielding metals.
Silver Price Targets: $74 to $102
The first price to watch on the way up is $74.12. That comes from a Fibonacci level, the 38.2% one. Starting from $67.82, silver would need to climb about 9.3% to get there. So if it can break past that $70 wall, $74 is right there.
Past that, the next targets are a lot higher. The chart shows $81.42, then $89.43, and finally $102.22.
From where we are now at $67.82, those would be gains of 20%, then 31.9%, and eventually over 50% if it hits the top one. That $102 number is the big goal in this bullish setup—it lines up with the 78.6% Fibonacci retracement mark on the chart.
But don’t take that to mean silver is headed straight up from $68 to $102. That’s not how this works. The Elliott Wave pattern needs the market to prove itself step by step. If the silver price gets past $74, that’s a good sign. But the real test comes in that $81 to $89 zone. Only after clearing that does $102 even start to look realistic.
Related Silver News: Analyst Predicts Another Big Move for Gold and Silver Prices
What Could Invalidate the Bullish Setup?
The biggest technical warning would be a breakdown through the support levels that the bullish count depends on. If silver falls through $60.51 and cannot reclaim it, the correction would be deeper than the preferred scenario.
A move below the $52.54 area would be even more concerning because it would take price into the lower support cluster marked on the chart.
Macro data could also determine whether those levels hold. Core PCE inflation is due Wednesday, with economists looking for a 0.2% monthly increase. The revised second-quarter GDP figure is also due, with expectations around 1.5%, followed by weekly jobless claims on Thursday, where the estimate is 208,000.
The biggest event is Federal Reserve Chair Kevin Warsh’s Jackson Hole speech on Friday, August 28. This is his first Jackson Hole appearance as Fed chair, making his comments important for Treasury yields, the dollar and precious metals. A more hawkish message could push yields and the dollar higher, putting additional pressure on silver. A softer policy message could have the opposite effect.
One factor worth adding to the technical picture is silver’s physical-market backdrop. The Silver Institute expects the market to remain in deficit for a sixth consecutive year in 2026, supported by demand from electronics, AI-related infrastructure and power-grid investment.
That does not prevent a technical correction, but it provides a fundamental reason for buyers to remain interested at lower prices.
Silver Price Forecast: What Happens Next?
The bullish path starts with silver holding the $60.51 area after a three-wave correction. If buyers defend that level and price breaks back through $70, the next targets would be $74.12, $81.42 and potentially $89.43. A sustained move through those levels would open the path toward the analyst’s $102.22 target.
The base-case path is a deeper consolidation between roughly $60.51 and $74.12. In this scenario, silver could spend time digesting its more than 17% monthly advance before attempting another breakout.
The $70-$74 region would remain the main resistance zone, with the reaction around $60.51 determining whether the larger bullish count remains valid.
The bearish path begins if silver loses $60.51 and then breaks the $52.54 support. That would weaken the five-wave interpretation from the July low and increase the risk of a decline toward the $51.50-$45.41 region shown on the chart.
For now, the technical setup remains bullish above those deeper levels, but the next correction will provide the clearest test of whether $74 and $102 are realistic targets or simply projections from a count that fails.
Frequently Asked Questions
Subscribe to our YouTube channel for daily crypto updates, market insights, and expert analysis.