

Silver price is moving again after spending months trapped in a broad correction. The metal is now trading just below $70 per ounce after climbing from around $63 over the past few days, extending a recovery that started from the July low near $55.50.
The timing is interesting because this is no longer just a bounce from oversold levels. Silver price has now pushed through a technical structure that has contained the price for most of 2026.
Katusa Research drew attention to the move, saying silver has broken out of a seven-month falling wedge after months of compression.
“Silver investors are ready for a show. Prices just broke out of a 7-month falling wedge. A clean breakout after months of compression is worth watching.”
The chart makes the setup easy to see.
What you'll learn 👉
Silver Breaks Out of a 7-Month Falling Wedge
Silver’s correction began after an extraordinary run culminated in a January 2026 peak of $116.69. The price then dropped sharply and spent the following seven months producing a sequence of lower highs and lower lows.
Katusa Research connects those swings with two descending trendlines, creating a falling wedge.
The upper trendline runs from the January peak through subsequent highs, including the rebound toward the upper-$80s in April. The lower boundary connects the progressively lower support area that eventually led to July’s $55.50 low.
That matters because falling wedges are generally viewed as potentially bullish reversal formations. Selling continues during the pattern, but the range between support and resistance contracts. A break above the upper boundary can indicate that sellers are losing control.
Silver appears to have now produced that breakout.
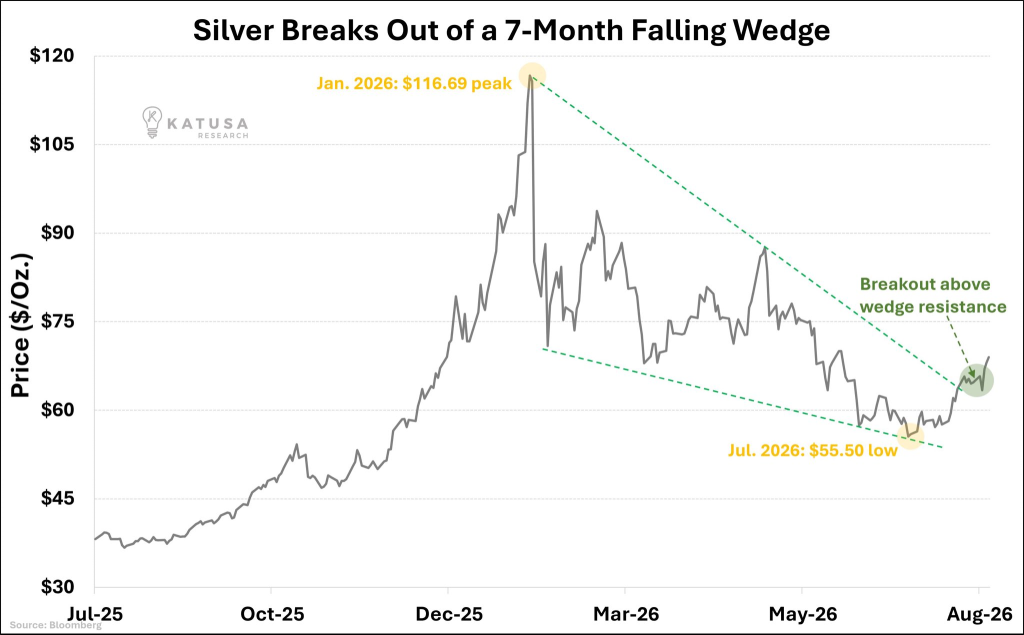
After bottoming at $55.50 in July, the metal recovered through $60, accelerated above $63 and has now approached $70. More importantly from a technical perspective, the move has carried silver above the descending resistance line that had capped rallies throughout the correction.
That is the signal Katusa Research is focused on.
There is still an important distinction between a breakout and a confirmed long-term reversal. Silver needs to remain above the former wedge resistance rather than quickly falling back inside the pattern. A successful retest of the breakout area followed by another move higher would make the technical case considerably stronger.
Silver Price Prediction: Where Could It Go Next?
The first major question is whether the silver price can turn the area around $65-$70 into support.
If it can, the chart becomes increasingly interesting.
The next obvious area is around $75, which acted as an important battleground several times during the seven-month correction. A convincing move through $75 could open the door toward the $80-$90 region, where silver encountered substantial resistance earlier this year.
Beyond that sits the much larger question: can silver eventually revisit its January peak at $116.69?
That is far from confirmed by the current breakout alone. Silver would first have to recover several layers of overhead resistance left behind during its decline.
Still, the risk/reward structure has clearly changed compared with a few weeks ago. In July, silver was making new corrective lows. It is now breaking the trendline responsible for defining that correction.
A bearish scenario should not be ignored either. If silver loses the breakout and falls decisively back inside the wedge, the move could turn into a false breakout. In that case, the $60 area would become important again, followed by the July low around $55.50.
For now, however, buyers have control of the short-term move.
Read also: Silver Price Prediction as Precious Metals Add $1.3 Trillion in Market Value
Why Is Silver Price Up?
Technical factors are only part of the story. Silver’s breakout has arrived alongside a much more favorable macro environment for precious metals.
A weaker U.S. dollar, movements in Treasury yields, elevated bond-market volatility and safe-haven demand have all contributed to the latest rally. The U.S. Treasury’s decision to increase its purchases of longer-dated government debt provided another major catalyst.
On August 19, the Treasury announced that it would double the size of certain buyback operations involving longer-duration securities, increasing purchases from $2 billion to at least $4 billion per operation for 10- to 30-year debt. The announcement came after the 30-year Treasury yield had climbed to around 5.34%, its highest level since 2007.
The market reaction was immediate. The 30-year yield dropped almost 10 basis points to around 5.19%, with the 10-year yield also moving lower.
That matters for silver because precious metals do not produce interest.
When bond yields decline, the opportunity cost of holding assets such as silver and gold decreases. Investors are giving up less potential interest income by owning a non-yielding metal instead of government debt. Lower real yields can make this effect even more important.
The dollar is another part of the equation. Dollar weakness generally makes silver cheaper for buyers using other currencies and can increase demand for dollar-denominated commodities.
There is also a safe-haven component. The bond market has been unusually volatile, with investors concerned about U.S. fiscal conditions, government borrowing costs and geopolitical risks. Those concerns helped drive the 30-year yield to a 19-year high before the Treasury stepped in with its expanded buyback plan.
One caveat is important: the Treasury’s intervention has not eliminated bond-market pressure. Yields rebounded somewhat the following day, which shows that investors remain uneasy about the longer-term fiscal picture.
For silver, that creates an unusual combination. Lower yields can directly improve the relative appeal of precious metals, but persistent instability in the bond market can independently increase demand for hard assets.
Subscribe to our YouTube channel for daily crypto updates, market insights, and expert analysis.






