Shiba Inu (SHIB) has once again captured the attention of the market, surging approximately 15% today after a brief consolidation period following the substantial gains witnessed in late February and early March. At the time of writing, SHIB is trading around $0.000035, marking an impressive 170% increase over the past week.
An analysis of the SHIB/USD chart reveals that since the launch of Shibarium in August, SHIB had been trading within a descending channel (depicted by the blue lines on the chart). However, a breakout occurred in late February, signaling the potential for a new bullish trend.
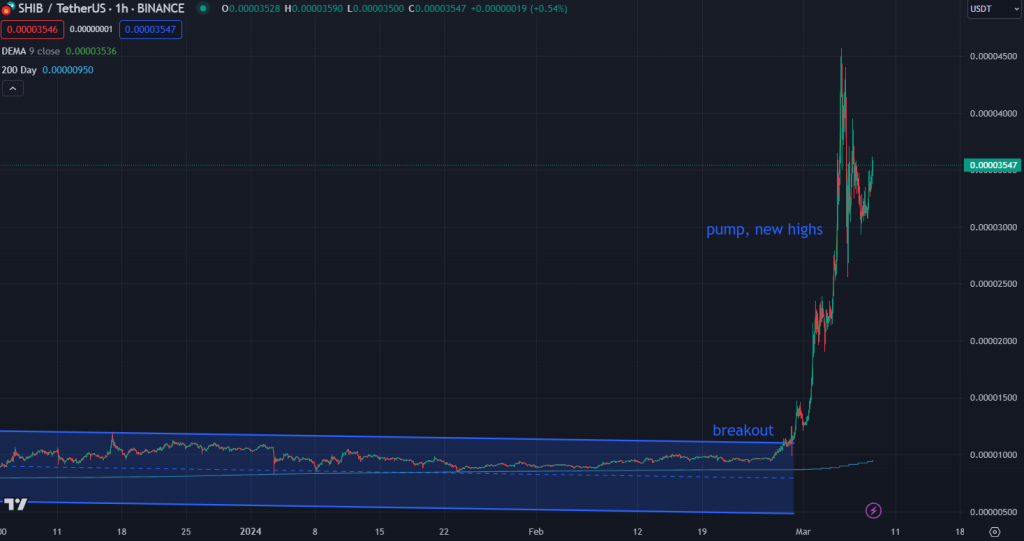
When a cryptocurrency breaks out of a long-term channel, it often enters a “discovery mode,” where it attempts to establish new highs. In the case of SHIB, this led to a pump that reached $0.000045 before consolidating to its current levels.
Fibonacci extension levels indicate that the next price targets for SHIB are set at $0.0000385, in line with the 2.618 Fibonacci extension level, and $0.0000436, corresponding to the 4.236 Fibonacci extension level. On the flip side, the $0.000033 support level aligns with the 0.236 Fibonacci retracement level, while the next strong support is at $0.00003, in line with the 0.786 Fibonacci retracement level.
Doge2014 raises 500K in days celebrating Dogecoin. Make potentially big profits and get in on exclusive airdrop!
Show more +An analysis of the Relative Strength Index (RSI) across various time frames reveals interesting insights. On the daily, weekly, 3-month, and 6-month charts, the RSI is hovering between 50 and 65, indicating a potentially bullish momentum. However, on the yearly chart, SHIB appears to be overbought, with the RSI currently at 84, suggesting potential for a correction in the longer term.
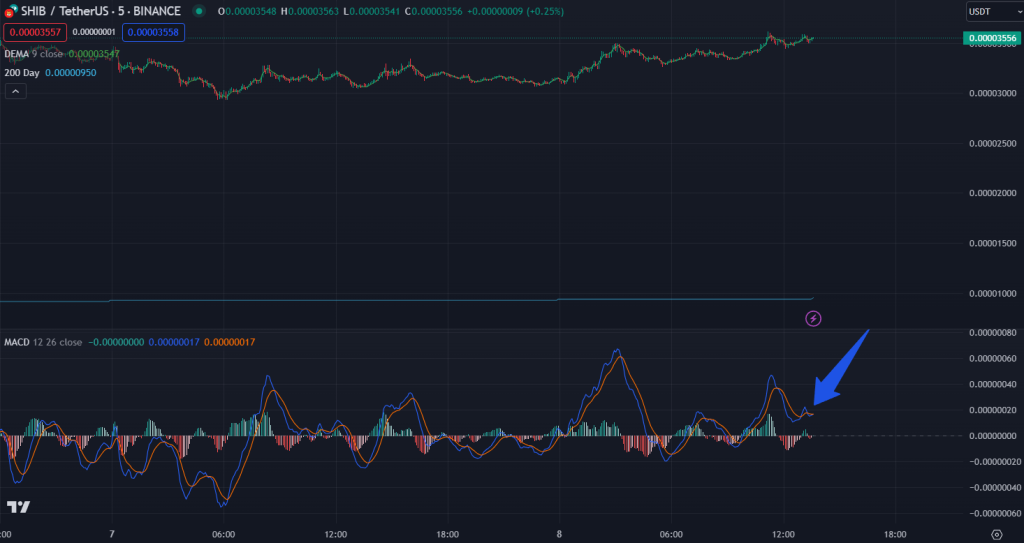
Additionally, the MACD (Moving Average Convergence Divergence) Line is currently below the MACD Signal Line, which could be interpreted as a bearish signal in the short term, as seen on the chart below:
Based on the technical analysis, it is plausible that SHIB could continue its upward trajectory in the short term, potentially reaching the Fibonacci extension targets mentioned above.
However, the overbought conditions on the yearly chart and the bearish MACD signal suggest that a correction or consolidation period may follow before any sustained long-term uptrend.
You may also be interested in:
- Solana’s Network Price Surge: Is Another Leg Up Imminent? SOL Experts Eye Further Gains
- Fetch.ai Price Surges: Here is Why Top Analysts Predict FET’s Rise to “Double Digits” Amid AI Boom
- New Shiba Inu (SHIB) Cryptocurrency Rivals SHIB, Predicted 1000% Growth

We recommend eToro
Wide range of assets: cryptocurrencies alongside other investment products such as stocks and ETFs.
Copy trading: allows users to copy the trades of leading traders, for free.
User-friendly: eToro’s web-based platform and mobile app are user-friendly and easy to navigate.