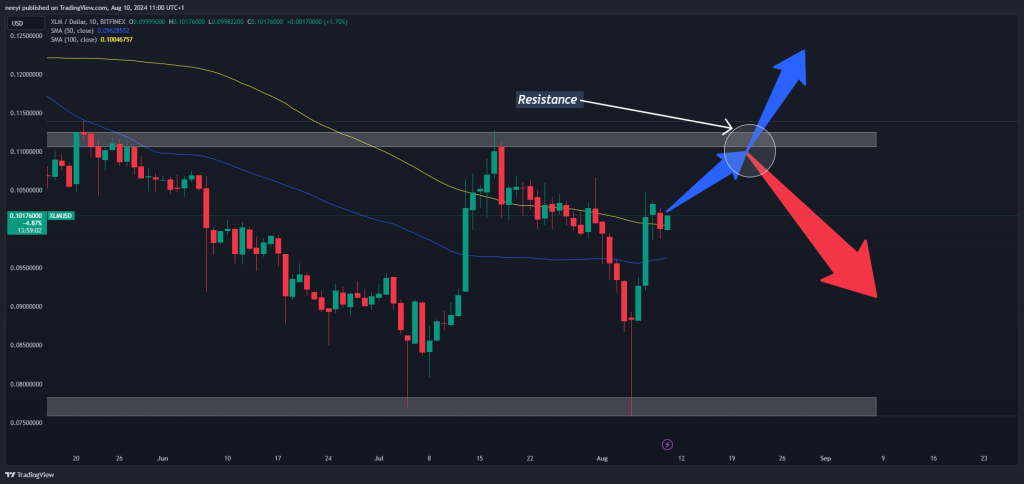
The price of Stellar’s XLM has increased by more than 30% in the past 6 days, raising hope for more bullish run.
The relative strength index on the daily chart is at 53, also showing that there is a lot of room to run in case the bullish move continues.
The price has broken above the 50-day simple moving average (SMA) decisively and is already breaking above the 100-day simple moving average (yellow wavy line). Closing above this will be interpreted as a bullish signal.

Read Also: Here Are Next Two Possibilities for SUI Token as Price Struggles to Break Key Resistance
Price Trading Within a Range
A broader look at price action shows that XLM is trading within a range with $0.078 being the support and $0.112 the resistance. The price rally could end at the resistance again like it did in May and July. This could trigger another move downward.
However, price action suggests the price may remain bullish if it breaks above the 100-day SMA (yellow line). Then, we could see a rally of around 10% to the key resistance level.
If history repeats, then we may see Stellar’s XLM dip by another 30% from the top of the range to the base.
Doge2014 raises 500K in days celebrating Dogecoin. Make potentially big profits and get in on exclusive airdrop!
Show more +Subscribe to our YouTube channel for daily crypto updates, market insights, and expert analysis.
We recommend eToro
Wide range of assets: cryptocurrencies alongside other investment products such as stocks and ETFs.
Copy trading: allows users to copy the trades of leading traders, for free.
User-friendly: eToro’s web-based platform and mobile app are user-friendly and easy to navigate.


