
Polymarket Odds Warning: Traders Are Suddenly Betting Against XRP Staying Above $1.00 in 2026


XRP price is trading near $1.07 at press time, but the betting markets are telling a different story.
Polymarket data shows a dramatic change in sentiment. In mid-May, the odds of XRP trading below $1.00 at any point in 2026 were below 50%. Today, at the end of July, those odds have jumped to 84%. That is a massive change in just two and a half months.
The prediction market is pricing in a high probability that XRP will dip below the psychological $1.00 level before the year ends.
What you'll learn 👉
What Changed in the Meantime?
A look at the current order book adds important context to that headline number. The last trade on this contract executed at 84¢, roughly in line with the 82-84% odds being quoted elsewhere, but the order book itself shows a notably wide 27-cent spread between the best ask (95¢) and best bid (68¢).
That’s a sign of relatively thin liquidity on this specific contract, while there’s meaningful size sitting on the ask side (over 1,100 shares available at 99¢), the bid side is comparatively light, with only around 60-100 shares available at each level down to 66¢.
In practice, this means the current odds, while a useful sentiment gauge, could move quickly if a single large trader steps in on either side; a caveat worth keeping in mind before treating 84% as a fixed, stable probability.
The odds change did not happen in a vacuum. Several factors have contributed to the growing bearish sentiment:
Bitcoin’s decline: In mid-May, Bitcoin was trading between $75,000 and $80,000. Today, it is below $65,000. The broader crypto market has continued to bleed.
Clarity Act stalling: The regulatory clarity that the market was hoping for has not materialized. The bill is stalled in the Senate, and Democrats are reportedly blocking it for political reasons.
Middle East tensions: Geopolitical uncertainty continues to weigh on risk assets. President Trump has threatened “strong military action” if Iran talks fail.
Low trading volume: Summer months are historically slow for crypto. Low volume means high volatility, and the market is vulnerable to big moves.
ETF outflows: While there have been some inflows recently, the overall trend has been mixed. Institutions are still cautious. XRP ETFs have a few millions of inflows on “green” days which is almost nothing in today’s financial markets (for context, Bitcoin ETFs pull hundreds of millions on positive days)
All of these factors have contributed to the bearish sentiment that is now reflected in Polymarket’s odds.
What Kalshi’s Data Adds to the Picture
Kalshi, another prediction market platform, offers a more granular view of where traders expect XRP price to end the year.
The data shows a roughly 28% chance of XRP trading between $0.75 and $0.99 at year-end. This is the highest probability among all price buckets on Kalshi right now.
This means that the crowd expects a dip, but not necessarily a collapse. The market is pricing in a move below $1.00, but not a catastrophic crash to $0.50 or lower.
For context, the odds of XRP trading above $1.50 at year-end are currently below 5%. The market is overwhelmingly bearish.
Read also: How Much XRP Could You Need to Retire as a Millionaire?
XRP’s Chart Analysis: Does the Market Agree?
The daily XRP chart shows a clear bearish structure. Price is trading near $1.0744 at press time, down from the $1.20 resistance level that has capped rallies for weeks.
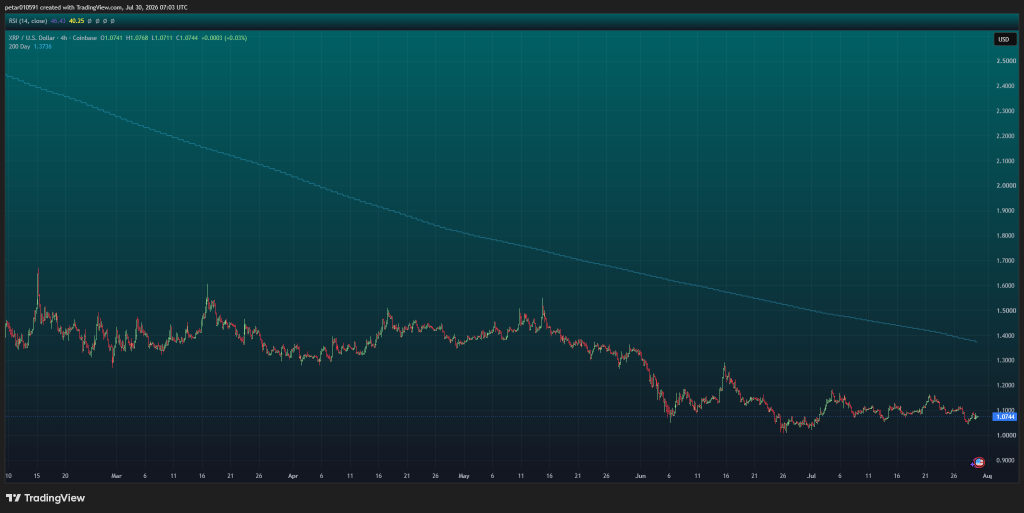
Key observations:
The descending trendline: XRP has been forming a series of lower highs since the June peak near $1.30. Each rally attempt has been sold into.
Support at $1.00: The psychological $1.00 level is the most important support on the chart. A break below this level could trigger a rapid decline to $0.94 and then $0.87.
Resistance at $1.10-$1.12: Price is currently trading below this resistance zone. A break above would be the first bullish signal.
Momentum indicators: XRP’s RSI is near 45-48, neutral but leaning bearish. MACD is showing weak bullish momentum, but the histogram is tiny.
The XRP price action supports the odds shift. XRP has been struggling to hold above $1.00 for weeks. The chart shows a market that is vulnerable to a breakdown. The Polymarket odds are not disconnected from the technical picture.
XRP Price Prediction: What This Means Going Forward
The prediction markets are signaling that a drop below $1.00 is the most likely outcome for XRP in the second half of 2026. The chart supports that view.
Short-term: XRP is likely to test the $1.00 support level in the coming weeks. A break below that could trigger a rapid decline to $0.94 and then $0.87.
Medium-term: If XRP holds $1.00, a relief bounce toward $1.10-$1.20 is possible. But the bearish structure remains intact until XRP breaks above $1.20 and then $1.30.
Risk factors: The Clarity Act passing would be a major bullish catalyst. A de-escalation of Middle East tensions could also trigger a relief rally.
My take: The Polymarket odds are a warning sign. The market is pricing in a drop below $1.00. The chart supports that view. I want to see a break above $1.20 and a bullish reversal signal before considering an entry.
Subscribe to our YouTube channel for daily crypto updates, market insights, and expert analysis.






