
Pi Coin is moving sideways at the start of the week after weeks of volatility triggered by its sharp May breakout. The Pi Coin price is trading at $0.6364, up nearly 2% over the past day. Trading volume has climbed 6.17%, but price action remains confined within a narrow range. With momentum indicators slowly improving, the market is awaiting a decisive move.
Let’s take a closer look at today’s setup.
What you'll learn 👉
📅 What We Got Right Yesterday
Yesterday’s prediction outlined three key scenarios. In the neutral case, we expected Pi Network price to stay between $0.61 and $0.66, with low volatility and weak momentum on both sides. That’s exactly what unfolded. The price stayed inside the projected range, showing no breakouts or breakdowns.
We also noted that a candle close above $0.66 could open the door to a short-term rally toward $0.70–$0.73. That threshold has not yet been crossed, keeping the bullish scenario on hold for now.
📊 Pi Coin Daily Overview (June 10)
- Current Price: $0.6364
- 24h Change: +1.97%
- Hourly RSI: 56.67
- Volume: Higher than the previous day
Pi Coin price remains in a holding pattern. The price is stuck between support at $0.60 and resistance at $0.66. The lack of breakout structure and low volatility suggest that the market is consolidating. Unless volume spikes and bulls reclaim higher levels, price action is likely to stay within this range.
🔍 What the Pi Coin Chart Is Showing
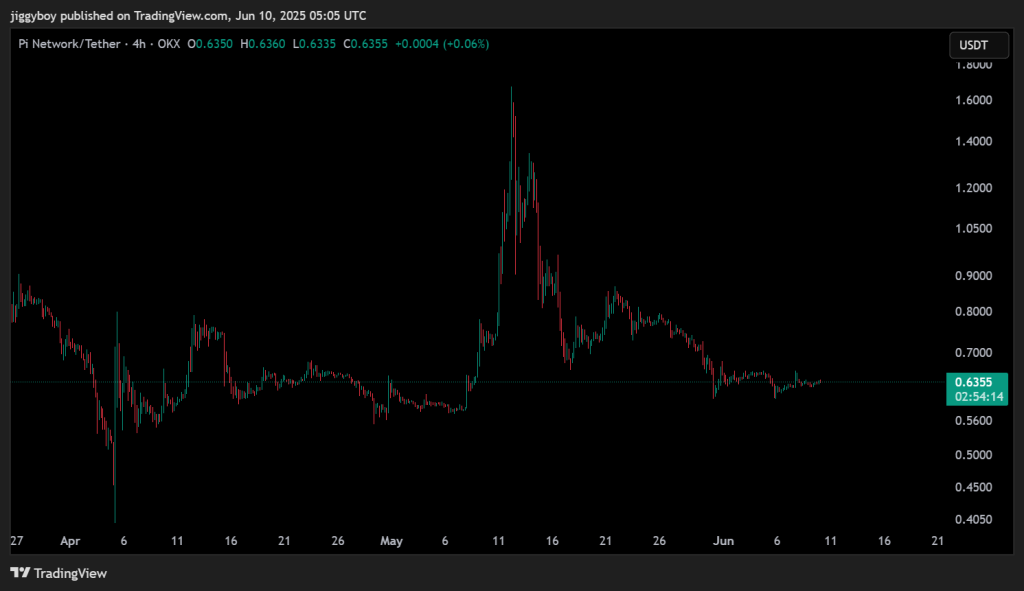
The 4H chart continues to reflect a post-rally cooldown. Following the steep May surge to $1.85 and the subsequent crash, Pi Coin has stabilized around the $0.60–$0.66 zone. Price has flattened in recent sessions, signaling a lack of directional bias.
There’s no clear trend in place right now. Buyers are defending the $0.60 level, but they’ve yet to generate enough momentum to push the token above resistance. Without a fresh catalyst, this range-bound structure may persist.
📈 Technical Indicators (Hourly Timeframe)
| Indicator | Value | Signal / Interpretation |
| RSI (14) | 56.67 | Mild bullish momentum |
| MACD (12,26) | +0.002 | Weak bullish crossover |
| ADX | 36.03 | Strong trend forming, favors buyers |
| Ultimate Oscillator | 57.76 | Light bullish pressure |
| ROC | +0.859 | Gradual upward shift |
| Bull/Bear Power | +0.0013 | Slight buyer advantage |
Summary: Most technical indicators lean slightly bullish. However, the strength is limited, and there is no strong confirmation of an imminent breakout.
🔮 Pi Coin Price Prediction Scenarios
Bullish Scenario: A confirmed 4-hour candle close above $0.66 could trigger a move toward $0.70–$0.73. Volume support would be required to sustain the breakout.
Neutral Scenario: If Pi Coin price continues to trade between $0.61 and $0.66, expect a range-bound session with limited volatility.
Bearish Scenario: A breakdown below $0.60 would weaken the structure and could drive the price lower toward $0.58 or even $0.52.
🧠 Wrapping Up
Pi Coin price is trading in a narrow band with no clear short-term direction. Indicators are showing early signs of strength, but buyers have yet to reclaim higher levels. As long as the price holds above $0.60, the token may continue to consolidate. Watch for any break above $0.66 to determine if a bullish breakout is forming.
Read Also: Bitcoin (BTC) Price Repeats 2021 and 2023 Pattern as Analysts Eye $119K Target
Subscribe to our YouTube channel for daily crypto updates, market insights, and expert analysis.

We recommend eToro
Wide range of assets: cryptocurrencies alongside other investment products such as stocks and ETFs.
Copy trading: allows users to copy the trades of leading traders, for free.
User-friendly: eToro’s web-based platform and mobile app are user-friendly and easy to navigate.