
The gold price has been moving at a pace that is hard to ignore. Gold is trading around $4,427.40, up from roughly $4,100 over the period covered by the latest chart analysis. The gold price pumped 1% today, and is now over $4.4k per ounce,
The broader trend remains bullish, but there is a catch. Momentum indicators are starting to cool, raising the possibility of a short-term pullback before gold makes another attempt at higher prices.
What you'll learn 👉
Gold Price Makes Another Big Move
We had a look at the gold chart, and the bullish structure remains clear. Gold is in a nice uptrend right now. It broke past $4,300 and keeps making higher highs and higher lows. The bulls are clearly in charge.
The big test coming up is $4,500. That’s a round number that often gets people’s attention. How gold behaves there will tell us a lot. If it busts through, $4,600 to $4,700 could be the next stop. There’s also a lot of action in the market. The tick count is sitting around 179.78K, which shows people are actively trading it. Volume is there.
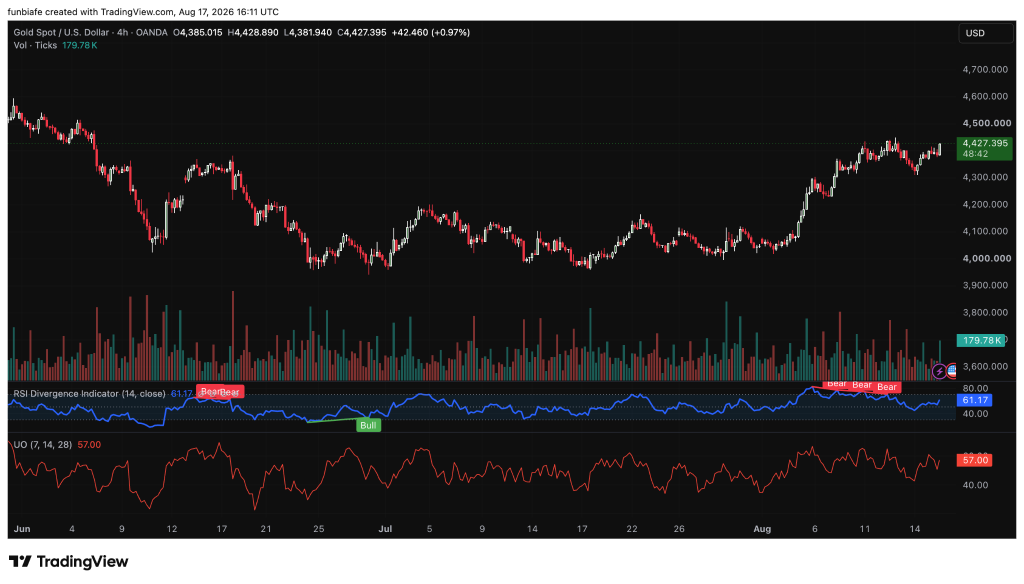
However, the gold price is beginning to show signs of fatigue. The RSI stands at 61.17, which remains bullish but is getting closer to the 70 level generally associated with overbought conditions.
The RSI divergence indicator has also produced bearish signals as price continues to print higher highs without the same confirmation from momentum. That does not mean the uptrend is over. It does mean buyers may need to consolidate before pushing much higher.
Here’s What’s Driving Gold Price Right Now
Several macro factors are supporting the gold price. The analysis points to global money-supply expansion, central-bank buying and geopolitical uncertainty as important sources of demand for the metal.
There is also a broader liquidity argument gaining attention in the market. Mark pointed to pressure involving Japan’s currency and Treasury holdings, arguing that Japan’s need to raise dollars to defend the yen can lead to Treasury selling and higher pressure on U.S. yields.
GOLD SURGES 14% IN 5 DAYS: THE WARSH HAWK STORY COLLAPSES
— Mark (@Mark4XX) August 17, 2026
Luke Gromen flagged a decisive shift over the last two weeks. Japan is selling Treasuries to defend the yen, Washington is responding with the same liquidity tools it always uses, and the hawk narrative around Warsh is… pic.twitter.com/2yGgcaUQsB
His thesis is that Washington may respond with liquidity measures instead of allowing Treasury-market pressure to run unchecked. Mark connects this environment to the recent strength in gold and argues that the market has become less convinced by the idea of a consistently hawkish policy stance.
Mark also claimed that gold rose 14% in five days, linking the move to these liquidity developments. That is an analyst interpretation, however, and should not be treated as proof that one policy event alone caused the rally. The price data itself is clearer: gold remains in a strong uptrend and has climbed from roughly $4,100 to $4,427.40.
The Key Gold Price Levels to Watch Next
The $4,500 line is the big one for gold right now. If buyers can push through it with heavy volume, $4,600 to $4,700 comes into play. On the downside, $4,381.94 is the first floor, that’s the last swing low. If that breaks, $4,300 to $4,200 is the main support zone underneath.
The Ultimate Oscillator is at 57.00. It’s still above 50, so the bigger trend leans bullish. But it’s been dropping from higher readings, which is a sign that bullish momentum is fading a little. Add to that the bearish divergence on RSI, and you’ve got a warning sign. It doesn’t mean the rally is over, but it does mean buying right here comes with some risk.
Read Also: Bitcoin vs. Gold: Is Saylor’s “Deep Freezer” Theory Being Tested?
Could Gold Price Move Even Higher From Here?
The bullish case remains intact as long as gold holds its key support levels. A strong break above $4,500 would give buyers room to target $4,600 and potentially $4,700. Such a move would also weaken the current bearish divergence by giving price enough momentum to continue establishing new highs.
On the other hand, a rejection around $4,500 could send the gold price toward $4,381.94 first. A deeper move could take it into the $4,300-$4,200 support zone. That kind of correction would not necessarily damage the broader trend. Gold could simply be testing previous breakout levels before attempting another move higher.
What Could Trigger a Gold Price Reversal?
The first warning would come if gold fails to break $4,500 and then loses $4,381.94. If gold breaks below that level, the chance of a drop to $4,300–$4,200 goes up. Right now, the overall trend is still up. But the indicators are flashing a yellow light. RSI is at 61.17, the Ultimate Oscillator at 57.00. Both are still in bullish territory, but they’re losing steam. The momentum is fading.
Here’s the key part, if gold can hold above that $4,300–$4,200 zone, buyers could use that as a launching pad for another run at $4,500. And if they finally crack that, $4,600–$4,700 becomes the obvious next target. So the trend is up, but don’t ignore the warning signs. A pause or a pullback wouldn’t be a surprise here.
FAQs
Subscribe to our YouTube channel for daily crypto updates, market insights, and expert analysis.