Cardano is heading into the new week at a crossroads. With April and part of May dedicated to recovering from losses, the ADA price seems to have returned to roughly the same region where demand began to materialize in the first place this year.
As of now, ADA is priced at approximately $0.237, with the market in a position to assess whether this level will prove to be an anchor for a rebound or just a new launching point for further declines.
The intrigue stems from the fact that there are currently very contrasting trends in terms of technical and on-chain indicators. While the chart remains bearish in nature, data reveals that whales are acquiring more and more ADA while improvements are being made in several important network metrics.
What you'll learn 👉
Factors Driving the ADA Price Right Now
The biggest issue facing the ADA price is the loss of the $0.247 support level. This wasn’t an ordinary support zone. The support level had remained intact since 2021 and had helped Cardano make successful recoveries.
The loss of this level has created a different narrative in regard to Cardano as the potential for an even more serious fall exists should the cryptocurrency fail to regain the level. Some experts claim that the breakdown below $0.247 could allow prices to fall towards $0.113, which is a drop of more than 50%.
However, not everything in the depths remains bearish. A large number of investors have been adding to their stakes in the asset recently. At present, wallets with one million ADA account for 67.5% of all ADA tokens, the largest share since 2020. That’s a notable development because whale accumulation often appears during periods when retail sentiment is weak.
Cardano’s stablecoin ecosystem has also been expanding. Stablecoin market capitalization on the network jumped by around 60% over the course of a week, making Cardano one of the fastest-growing networks in that category.
Another story worth watching is governance. Voters in the Cardano community will be determining the future of a proposition involving the allocation of 32.9 million ADA to support Input Output Global’s research plans for the year 2026. There seems to be some controversy surrounding this proposition since many people seem to oppose it.
Here’s What the ADA Chart Is Showing
We had a look at the ADA chart, and the market is sitting at a very interesting point. The rally that pushed ADA toward $0.29 earlier in May has completely faded. Sellers gradually took control and dragged the ADA price back toward the March lows around $0.23.
The one constant indicator which has been acting as a hindrance during this entire period has been the 100 SMA. The current value of the 100 SMA is currently at $0.246. Every meaningful recovery attempt that has been made since March has failed at this level. In several cases, ADA briefly moved above it before getting pushed back down.
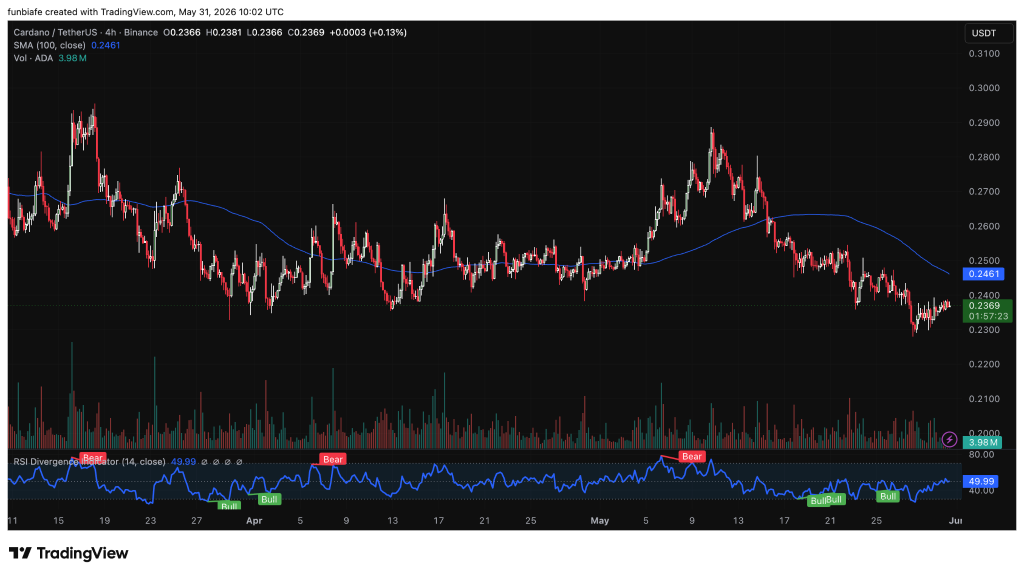
That makes $0.246 one of the most important levels on the chart right now. The good news for bulls is that several bullish RSI divergence signals appeared between May 20 and May 25. Similar signals appeared near the March lows and were followed by a recovery that carried ADA from roughly $0.235 to nearly $0.27.
Three bullish divergences appearing in such a short period don’t guarantee a rally, but they do suggest that selling pressure may be losing some strength. The problem is that there hasn’t been any urgency with volume. There was an uptick from the $0.23 region, but it wasn’t very significant, meaning buyers must show they can assert themselves.
Read Also: Here’s Why Humanity Protocol (H) Price Is Pumping
Where Could the ADA Price Go Next?
The answer largely depends on what happens around $0.246. If buyers manage to reclaim the 100 SMA and push the ADA price above that level, the next area to watch sits between $0.255 and $0.260. A stronger recovery could then target the April consolidation zone around $0.27 to $0.275.
That would fit the bullish divergence setup that has been developing over the past couple of weeks. If the market fails to break through resistance, attention shifts back to support. The $0.230-$0.233 area has held multiple times already.
Losing this area would lead to another support level in the range of $0.220-$0.225. If price breaks below this area, it could add weight to the bearish scenario, with expectations of a bigger correction being made. For now, it looks like the market is stuck between these two scenarios.
The ADA price starts the week with both opportunities and risks on the table. The technical picture remains fragile after the loss of the $0.247 support level, and buyers still need to reclaim the 100 SMA before a stronger recovery can begin.
At the same time, whale accumulation continues to rise, stablecoin activity on Cardano is growing rapidly, and the network continues to attract attention through its governance and development efforts.
FAQs
Subscribe to our YouTube channel for daily crypto updates, market insights, and expert analysis.