
In our last Hedera weekly prediction, we said a daily close above $0.075 could send the HBAR price toward $0.085, with $0.09–$0.10 possible if volume increased.
That breakout never came, and HBAR instead slipped to $0.0650, losing the key $0.070 area along the way. The bearish case is now stronger, but there is one reason buyers may still fight back: RSI is at 26.54, putting HBAR in oversold territory.
The bigger question this week is whether $0.065 holds. A recovery through $0.070 could give bulls room to test $0.075 again, but a daily close below $0.065 could open the door to $0.060 and $0.050.
What you'll learn 👉
Hedera Price Technical Analysis
We had a look at the chart, and the trend is clearly bearish. After reaching above $0.074 in late July, the HBAR price began forming lower highs and lower lows, with the latest decline taking it from around $0.071 in early August to $0.0650. This puts HBAR close to the lower end of its recent trading range.
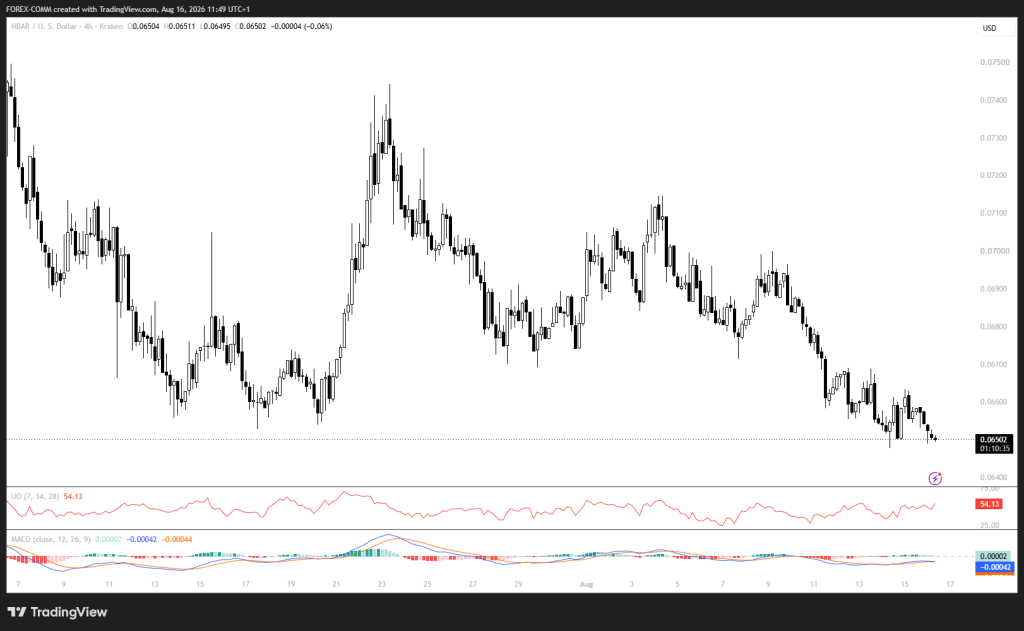
The $0.065 area is now the first major support. The chart shows several reactions around $0.065–$0.066, making this zone important for the weekly outlook. If buyers defend it, HBAR could attempt a recovery toward $0.068–$0.070, but the previous swing highs around $0.070–$0.071 remain resistance.
Momentum is still weak. The RSI is at 26.54. That is oversold territory. It means the drop has been hard and fast, so a short-term bounce could happen. But do not mistake that for a real turn. Oversold alone does not mean the trend is reversing.
HBAR is also trading below its 7-day SMA at $0.0665 and its 200-day SMA at $0.0852. Both are bearish. The longer-term average is way above the current price, which tells you the bigger picture is still down.
Now for the one small bright spot. Look at the MACD. The blue line is at -0.00042. The signal line is at -0.00044. The difference is tiny, a positive histogram of 0.00002. That is a very early sign that short-term momentum might be improving. The Ultimate Oscillator at 54.13 is also above 50, which supports that idea.
But here is the catch: both readings are marginal. They are not strong enough to confirm a real recovery. So yes, there is a flicker of improvement, but it is faint. Do not get ahead of yourself.
Key Factors Pushing the Hedera Price
Hedera processed about 346,800 transactions in 24 hours, yet generated only around $341 in revenue. That works out to roughly $0.001 in revenue per transaction, renewing concerns about how much network activity translates into direct economic demand for HBAR, which is used for fees and staking.
The broader market also declined 0.08%, with Bitcoin down 0.05%, but HBAR fell 1.04% to $0.0650. On the positive side, Hedera plans to move from Record Stream to Block Stream, with testnet changes planned for September and mainnet deployment in October, designed to reduce costs and latency.
Wyoming’s FRNT stablecoin has also integrated with Hedera through Fireblocks, although the stablecoin does not directly require HBAR for issuance.
The near-term ETF picture is less favorable. Grayscale withdrew its HBAR ETF filing on August 7, removing one potential source of institutional demand, although Canary Capital still has an active filing. This comes as HBAR trades below both its $0.0665 7-day SMA and $0.0852 200-day SMA.
Read Also: How High Can Cardano (ADA) Price Go This Week
Where Will Hedera Price Go This Week?
If HBAR holds $0.065 and gets back above $0.070, buyers might try for $0.075. A daily close above $0.075 could reopen $0.085. And if volume picks up, $0.09 to $0.10 could come into play.
If nothing happens, the HBAR price drifts between $0.065 and $0.070. The oversold bounce meets a weak structure. The ETF news is still weighing on things. To turn this range more bullish, you need a clear move above $0.070.
If Hedera closes below $0.065 on the daily, $0.060 is the first stop. Lose that, and $0.050 becomes the next target. That would keep the downtrend intact.
Frequently Asked Questions
Subscribe to our YouTube channel for daily crypto updates, market insights, and expert analysis.