Fresh inflation numbers came out on May 12, 2026. Neither gold nor US stocks liked them. Inflation soared to 3.8%, beating expectations. The news caused a presumption that the Federal Reserve will hold high interest rates for longer. As a consequence, the US Dollar and Treasury yields pumped.
The gold price fell from nearly $4,745 to around $4,686 in one session. People locked in their profits and reacted to those rising yields. Stocks took a hit too. The S&P 500 dropped, and big names like Nvidia and AMD lost ground.
Here’s what’s worrying everyone: inflation is sticking around. And the easy days for risky assets might be over sooner than anyone thought.
What you'll learn 👉
Gold/SPX Volatility Spread Hits Levels Last Seen Before the 2008 Crash
Strategist Mike McGlone from Bloomberg Intelligence saw something unusual. Traders are paying close attention. He said gold’s price swings over the last 180 days are now 2.3 times bigger than the S&P 500’s swings. That is the widest gap since 2006, right before the global financial crisis.
He put that gold chart next to another one: the Buffett Indicator, which compares the total US stock market value to the size of the whole US economy. Twenty years ago, when that volatility gap hit near 2.5 times, US stocks topped out soon after. Then stocks crashed into a terrible bear market. The Buffett Indicator fell from about 1.3 times down to nearly 0.6 times by the bottom in 2009.
Hoping This Indicator Is Wrong? Gold Volatility
— Mike McGlone (@mikemcglone11) May 10, 2026
Extreme peaks in gold vs. S&P 500 volatility have a tendency to front-run drawdowns in the US stock market. Is it different this time? My graphic of the spread between gold and SPX volatility on the same scale as the stock market's… pic.twitter.com/GQeWzftqzy
McGlone thinks this is a warning. Gold normally acts like a safe place to hide when things get scary. People buy it because it feels stable. But now gold is jumping around like a risky bet. That kind of thing tends to happen near big turning points in markets, when fear and gambling take over.
He also said US stocks may be in trouble. The total value of the stock market has climbed to about 2.4 times the size of the whole US economy. That is one of the highest levels ever. Put simply, the stock market has grown way bigger than the real economy. If inflation drops fast after running too hot for too long, companies could see their profits and stock prices get hit hard.
News Pushing Gold Price
The biggest driver behind Tuesday’s market reaction was the hotter-than-expected US inflation report. April CPI rose 3.8%, keeping pressure on the Federal Reserve to maintain restrictive policy. Higher interest rates increase Treasury yields and strengthen the US dollar, both of which usually weigh on the Gold price because gold does not generate yield.
Also, geopolitical tensions are preventing a deeper selloff in precious metals. President Donald Trump said a proposed US-Iran ceasefire was on “massive life support” after rejecting Tehran’s latest offer. That comment kept safe-haven demand alive even as traders reduced exposure after the inflation data.
Oil prices are adding to inflation worries. Because of the problems in the Strait of Hormuz, Brent crude went above $105 a barrel. More people are starting to worry that energy prices could stay high for months.
When oil goes up, it usually pushes other prices up too. And that can be good for gold, because people buy gold when they want to protect their money from losing value.
Central banks are still buying a lot of gold. That puts a solid floor under the price. Early numbers for 2026 show global gold demand hit 1,231 tonnes in the first three months of the year. That is 2% higher than the same time last year.
Big firms like Goldman Sachs and JPMorgan Chase still think gold will end the year somewhere between $5,400 and $6,300. The main reason: central banks keep piling up reserves.
What the Gold Chart Is Showing Right Now
We had a look at the chart. The market looks stuck in a wide back-and-forth after the big run up earlier this year. Gold opened near $4,679. It briefly touched above $4,695, but then sellers took over and pushed it back down to around $4,686.
If you look at the chart, buyers stepped in hard after the heavy selloff in late March and early April. Gold bounced from near $4,100 and managed to win back most of that lost ground over the next few weeks. That bounce created a big trading zone between roughly $4,500 and $4,900. And inside that zone, price moves have gotten messy and hard to read.
Related Gold News: ChatGPT Predicts Where Bitcoin and Gold Will Go If Offshore Dollar Usage Keeps Rising
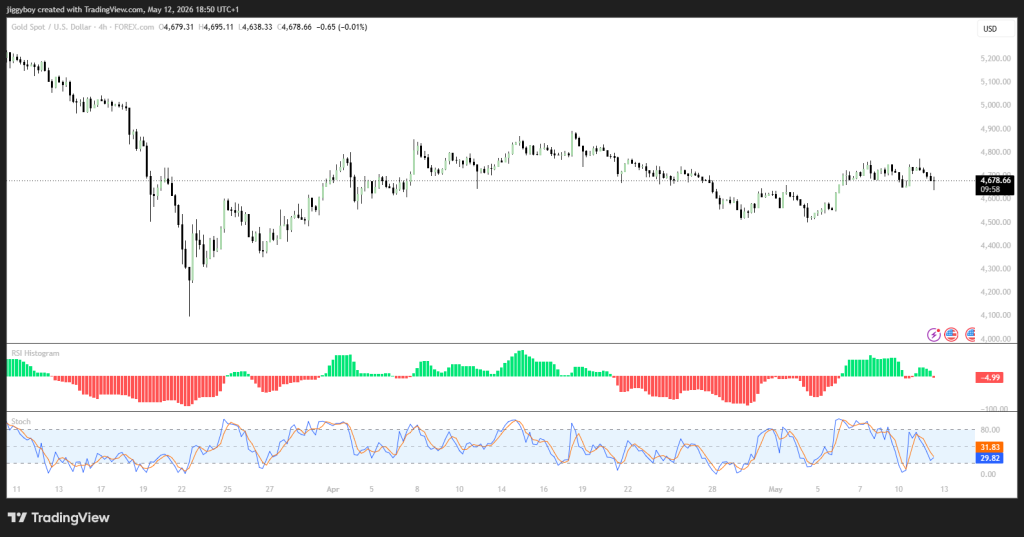
The tools that measure buying power are starting to fade. The RSI histogram turned negative again. That means bullish strength is dying out after a few tries to break past the recent highs. At the same time, the stochastic oscillator fell toward oversold territory. Both lines moved lower near the 30 mark. That tells you short-term demand is getting weak.
The price pattern also shows lower highs over the last few sessions. Sellers have repeatedly held the line at $4,800 to $4,900. They won’t let price break out. If gold loses its footing near
$4,600, traders may start eyeing the $4,500 zone again. A climb back above $4,800 would probably bring buyers back in force.
Gold is stuck between two big opposing forces: fear of rising inflation and tighter money from the Fed. People are watching volatility numbers closely because history shows that when the gold versus stocks spread moves wildly, big stock market drops have often followed.
Gold still has three things going for it: world tensions, strong central bank buying, and high oil prices. But if interest rates keep rising and the dollar keeps getting stronger, gold and stocks could have a harder time in the weeks ahead.
Frequently Asked Questions
Subscribe to our YouTube channel for daily crypto updates, market insights, and expert analysis.