
Gold price has started recovering after Monday’s heavy selloff, but the rebound still faces a test before the outlook improves. The metal has regained some ground since yesterday, and its response to nearby resistance could determine whether the recovery continues through the rest of the week.
This rebound comes as The Kobeissi Letter points to an unusually high number of large daily declines in gold futures. The accompanying historical chart puts the recent selling into perspective and helps explain why an upward move alone may not be enough to confirm a change in direction.
What you'll learn 👉
Gold Futures Have Recorded 7 Heavy Daily Declines This Year
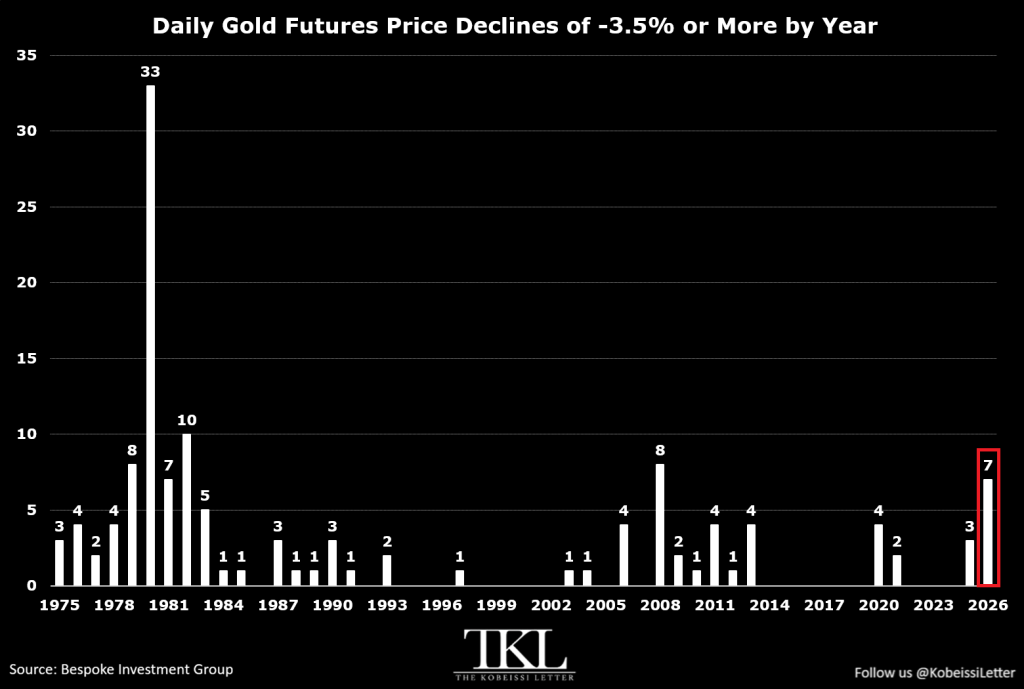
The Kobeissi Letter reports that gold futures have recorded 7 daily declines of at least 3.5% during 2026. That is the highest count since 2008 and already more than double the 3 comparable sessions recorded during 2025.
A look at the chart shows how unusual this year’s reading has become. Most years since the early 1980s recorded between 0 and 4 sessions with losses of this size. The 2026 count has already exceeded that range, with 3 months of trading remaining.
The chart, shared by The Kobeissi Letter and credited to Bespoke Investment Group, provides several useful comparisons:
- 2026 has recorded 7 daily declines of at least 3.5%, compared with 3 during 2025.
- 2008 recorded 8 comparable sessions, which remains slightly above the current count.
- 1982 recorded 10 comparable sessions, compared with 7 during 1981.
- 1980 recorded 33 comparable sessions, the largest annual total shown on the chart.
These figures show that severe daily losses have become more frequent. They do not mean gold has declined every day, but they demonstrate how often substantial selling has interrupted trading this year.
The Historical Gold Chart Shows Why The 1982 Comparison Matters
The Kobeissi Letter describes 2026 as being on track for gold’s most volatile year since 1982. The historical chart explains that comparison, although the remaining months will determine where the final count lands.
Gold recorded 10 daily declines of at least 3.5% during 1982. The current total of 7 remains below that figure and below the 8 recorded during 2008. Additional heavy losses during the final quarter could take 2026 beyond the 2008 count.
The 1980 reading remains far above every other year shown. Its 33 qualifying sessions demonstrate how extreme that period was, so the current figures should not be interpreted as a repeat of those conditions.
The chart specifically counts large downward sessions. That makes it useful for understanding the frequency of heavy selling, although it does not capture every aspect of gold volatility.
The practical message is straightforward: gold has suffered unusually frequent steep daily losses this year. That backdrop makes the strength and durability of the latest recovery especially important.
Gold Futures Face Their First Annual Decline Since 2022
The Kobeissi Letter puts gold futures down approximately 5.4% since the beginning of 2026. Gold would record its first annual decline since 2022 if that loss remains through the end of December.
The commentary also describes this weakness as following gold’s best annual performance since 1979. That creates a clear contrast between the previous year’s strong advance and the more difficult conditions this year.
An annual decline and frequent heavy daily losses describe different parts of the same situation. The annual figure shows where gold stands compared with the beginning of the year. The chart shows how often the metal has suffered a substantial loss within a trading session.
Together, those readings explain why the latest bounce needs to be assessed within the broader price trend. Gold can recover over several sessions without reversing its annual losses or ending the bearish pressure behind the recent decline.
The Kobeissi Letter identifies the bond market as a contributor to these volatile conditions. Its commentary connects the wider backdrop to gold’s turbulence, but the supplied chart focuses on the daily losses themselves.
Read Also: Here’s the XRP Price If It Copies QNT’s Move – But There’s a Catch
Gold Price Recovery Faces Its First Resistance Near $4,250
Gold price dropped around 4% on Monday before showing recovery signs from Tuesday. The supplied price analysis places the metal around $4,200, with the first resistance near $4,250.
The current upward move is best treated as a retracement within the bearish trend. That means gold is recovering part of its recent decline, but the broader direction has not necessarily changed.
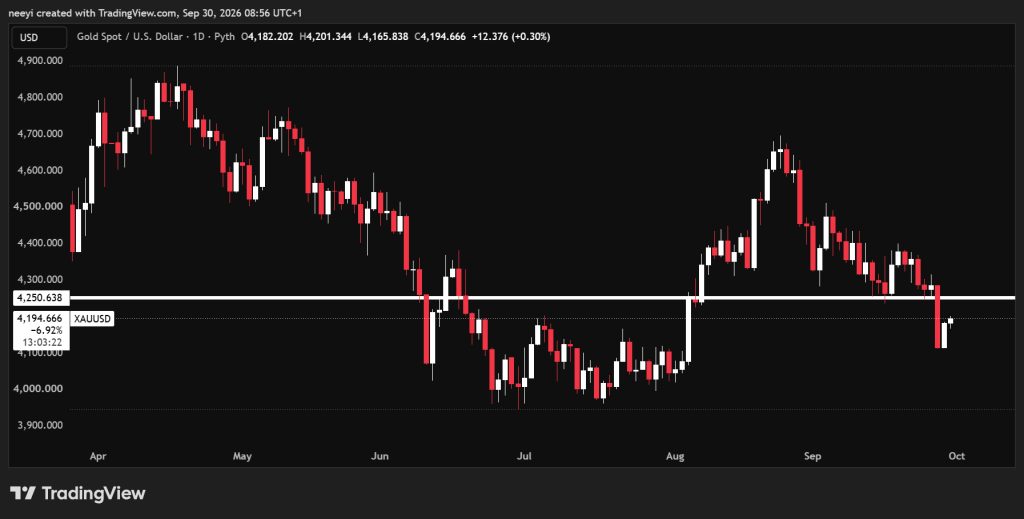
The first step toward a stronger recovery would be a break above $4,250. Gold could then move toward $4,290, which becomes the next resistance test.
A break above $4,290 could open the path toward $4,500. These levels form a sequence, so the higher target depends on buyers overcoming the earlier barriers.
| Gold Price Level | What The Level Means |
|---|---|
| Around $4,200 | The current trading area in the supplied analysis |
| Around $4,250 | The first resistance test for the recovery |
| Around $4,290 | The next upside level after a $4,250 breakout |
| Around $4,500 | The higher target if the recovery continues |
Gold’s response around $4,250 matters because that level could either interrupt the rebound or allow it to develop further.
Gold Price Could Resume Its Decline Or Extend The Recovery
The supplied analysis still describes bearish momentum as the strongest force in the current setup. That leaves the rebound vulnerable if gold reaches resistance and fails to move through it.
The rest of the week could develop through several possible scenarios:
- A rejection near $4,250 could renew the decline. Sellers defending that resistance would keep the current bearish outlook intact.
- Consolidation could follow if neither side takes control. Gold could stabilize within a range without establishing a stronger recovery.
- A break above $4,250 and $4,290 could extend the rebound. Those moves could bring $4,500 into view before the week ends.
A sustained break above $4,500 would strengthen the possibility of a more lasting trend change. Until that happens, the supplied assessment treats the upward movement as a recovery within a market that remains bearish.
FAQs
Subscribe to our YouTube channel for daily crypto updates, market insights, and expert analysis.