Crypto Price Predictions for Today, September 30: Bitcoin (BTC), Ethereum (ETH), and Solana (SOL)


Bitcoin price is nearing the lower boundary of its recent trading range, and Ethereum faces a similar test after several days of consolidation. Solana has already moved into a lower range this week, so its next move could reveal whether buyers can recover some lost ground.
These setups give today’s crypto price predictions a common theme, although the indicators reveal different conditions beneath the surface. Bitcoin and Ethereum have weaker momentum readings, but Solana has a more balanced mix. September 30 could bring another session inside familiar ranges or a breakout that opens the door to fresh price targets.
What you'll learn 👉
Bitcoin Price Nears $82,400 Support After A Week Of Consolidation
Bitcoin price has traded between $82,400 and $84,800 since Wednesday, September 23. BTC currently trades around $83,000, which places it closer to support than resistance.
That position makes the next support test important. Bitcoin is roughly $600 above the lower boundary, so a relatively modest decline could bring buyers back to the level that has contained recent losses. A successful defence would preserve the range and leave room for another recovery toward $84,800.
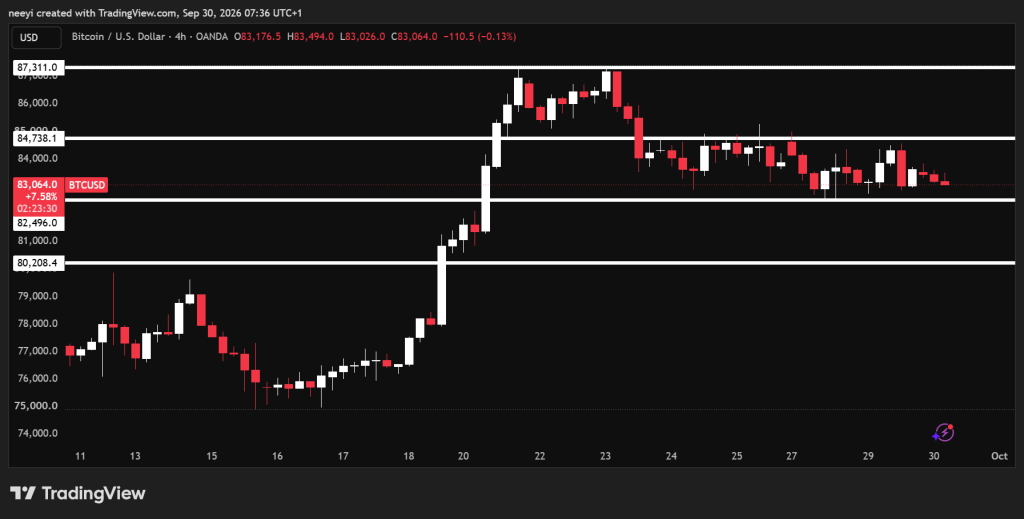
The repeated consolidation also shows that neither side has established control beyond these boundaries. Buyers have prevented a deeper decline, but sellers have continued to limit advances near resistance.
A sustained break below $82,400 would weaken that balance and put $80,200 into focus. The bullish alternative requires Bitcoin price to clear $84,800 and hold above it before $87,300 becomes a realistic target for today.
Bitcoin Indicators Show Weaker Momentum Despite Some Buying Pressure
Bitcoin’s RSI reading of 44.089 places momentum below the midpoint of 50. Sellers have a modest advantage, although the reading remains above the usual oversold threshold of 30. BTC therefore has room to decline further without immediately reaching oversold conditions.
The MACD reading of −166.5 supports that weaker outlook. The negative value indicates that the shorter moving average remains below the longer moving average. However, this snapshot alone cannot establish whether bearish momentum is accelerating.
The Ultimate Oscillator offers a more balanced reading at 52.013. Its position slightly above 50 indicates some positive buying pressure across its combined periods, but the advantage is small.
Bull/Bear Power is negative at −667.094, which supports the view that sellers retain an advantage relative to the indicator’s moving average.
| Indicator | Value | What The Reading Means |
|---|---|---|
| RSI (14) | 44.089 | Momentum favours sellers modestly without reaching oversold territory. |
| MACD (12,26) | −166.5 | The moving average relationship remains bearish. |
| Ultimate Oscillator | 52.013 | Buying pressure has a slight advantage across the measured periods. |
| Bull/Bear Power (13) | −667.094 | The negative reading supports continued seller pressure. |
Bitcoin (BTC) Price Prediction For Today
- Bullish Scenario: Bitcoin breaks above $84,800 and holds that level. Stronger demand could then extend the recovery toward $87,300.
- Neutral Scenario: Buyers defend $82,400, but BTC cannot clear $84,800. Price continues to move within the established range.
- Bearish Scenario: Bitcoin loses $82,400 and fails to recover it. Continued selling could carry BTC toward $80,200 before the session ends.
Ethereum Price Tests The Lower End Of Its $2,600 To $2,800 Range
Ethereum price has remained inside a defined range since September 20, with support around $2,600 and resistance near $2,800. ETH is now close to the lower boundary, so the strength of that support could determine its next move.
Previous defences of $2,600 make it an important reference point. Another bounce would preserve the consolidation, but a sustained break below it would expose Ethereum price to a deeper decline.
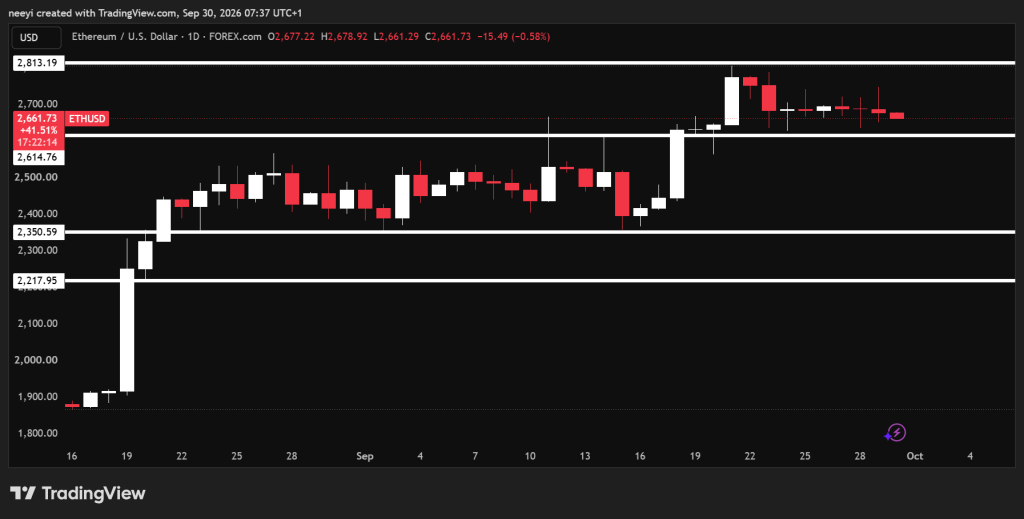
The downside levels in this setup are $2,400 and then $2,300. Those targets depend on selling pressure expanding after support fails, particularly if ETH cannot quickly recover $2,600.
The recovery path begins around $2,700, which lies near the middle of the range. A move above that level would improve Ethereum’s position, but $2,800 remains the established resistance. ETH would need to overcome that upper boundary before a move toward $3,000 becomes more convincing.
Ethereum Indicators Give Sellers A Modest Advantage
Ethereum’s RSI stands at 46.867, close to the midpoint but slightly below it. This reading points to mildly weaker momentum rather than an extreme imbalance between buyers and sellers.
The MACD value of −2.18 also leans bearish because the shorter moving average is below the longer moving average. Additional readings would be needed to determine whether that gap is narrowing or widening.
The Ultimate Oscillator reads 48.257, which places buying pressure slightly below the midpoint across its measured periods. That fits Ethereum’s struggle near the bottom of its range.
Bull/Bear Power is negative at −21.6722 and adds support to the weaker picture. Taken together, these readings favour another support test unless buyers improve Ethereum’s price position.
| Indicator | Value | What The Reading Means |
|---|---|---|
| RSI (14) | 46.867 | Momentum is close to balanced but leans slightly toward sellers. |
| MACD (12,26) | −2.18 | The moving average relationship remains mildly bearish. |
| Ultimate Oscillator | 48.257 | Buying pressure is slightly weaker across the measured periods. |
| Bull/Bear Power (13) | −21.6722 | Seller pressure remains evident relative to the moving average. |
Ethereum (ETH) Price Prediction For Today
- Bullish Scenario: Ethereum recovers $2,700 and then breaks above $2,800. A sustained breakout could create room for a move toward $3,000.
- Neutral Scenario: ETH holds $2,600 support and continues trading between $2,600 and $2,800 without a decisive breakout.
- Bearish Scenario: Ethereum falls below $2,600 and cannot reclaim support. The next potential downside targets become $2,400 and $2,300.
Solana Price Needs To Recover $120 After Entering A Lower Range
Solana price moved into a lower trading range on Monday and has since traded mainly between $116 and $120. This gives SOL a different starting point from Bitcoin and Ethereum because its recent price action already includes a move lower.
The immediate test is whether buyers can defend $116 and recover the upper boundary. A bounce inside the range would keep consolidation intact, but a sustained move above $120 would provide stronger evidence of a recovery.
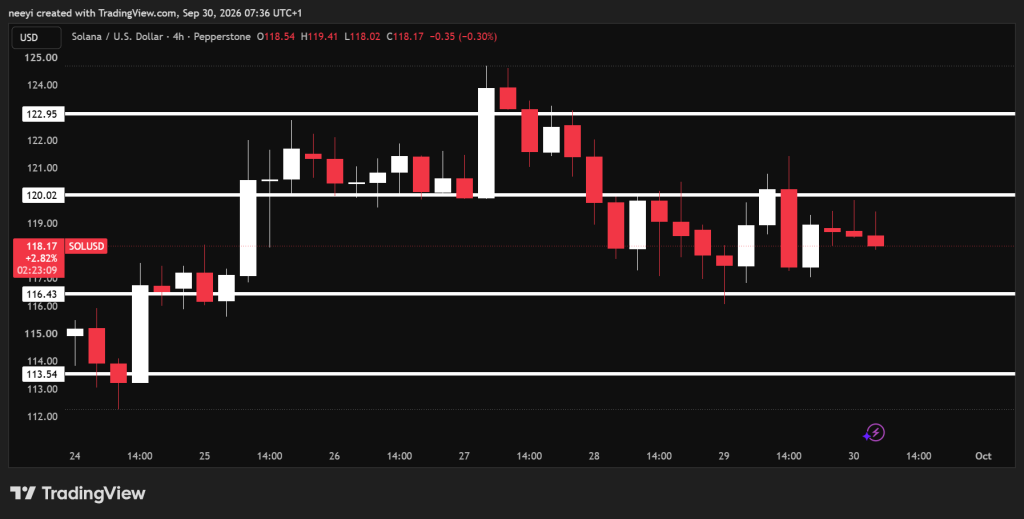
Solana’s nearby upside targets are $122 and $123. Those levels become relevant if buyers clear $120 and prevent the breakout from reversing.
A loss of $116 would instead extend the recent weakness and bring $113 into focus. Until either boundary breaks, the current range remains the clearest framework for today’s Solana price prediction.
Solana Indicators Show A More Balanced Price Setup
Solana’s RSI reading of 49.471 is almost at the midpoint. Neither buyers nor sellers have a clear momentum advantage through this indicator.
The MACD reading of 0.349 is positive, so the shorter moving average is above the longer moving average. That supports a modest bullish bias, although it does not confirm a breakout above $120.
The Ultimate Oscillator stands at 52.965 and also gives buying pressure a slight advantage. Bull/Bear Power remains negative at −0.952, however, so seller pressure has not disappeared.
| Indicator | Value | What The Reading Means |
|---|---|---|
| RSI (14) | 49.471 | Momentum is nearly balanced between buyers and sellers. |
| MACD (12,26) | 0.349 | The moving average relationship has a modest bullish bias. |
| Ultimate Oscillator | 52.965 | Buying pressure has a slight advantage across the measured periods. |
| Bull/Bear Power (13) | −0.952 | Some seller pressure remains despite the positive readings elsewhere. |
Solana (SOL) Price Prediction For Today
- Bullish Scenario: Solana clears $120 and holds above it. Buyers could then push SOL toward $122 or $123.
- Neutral Scenario: SOL remains between $116 and $120 because neither side produces enough pressure for a sustained breakout.
- Bearish Scenario: Solana loses $116 support and fails to recover it. Further selling could take the price toward $113 today.
FAQs
Subscribe to our YouTube channel for daily crypto updates, market insights, and expert analysis.