
Gold and silver are moving higher, but both prices are heading toward levels that have stopped previous advances. Gold is climbing back toward the top of a range that has guided it lower since early September. Silver is nearing the upper boundary of a wedge that has contained its price since August. The next test for each metal is whether this rise can get past resistance or ends with another move lower.
The Fed decision came on September 16, so the question today is how gold and silver behave afterward. Analyst Fthegurus said ahead of the decision that a 25 basis point hike was roughly 90% priced in. The analyst’s point was that a surprise, or a less hawkish message than expected, could move metals more than the expected decision itself.
Gold and Silver open firm into FOMC day.
— Fthegurus (@fthegurus) September 16, 2026
A 25bp hike is already ~90% priced in.
The decision itself may not move metals. The surprise will.
If the Fed holds — or hikes and sounds less hawkish than the market wants — fireworks. 🎇 pic.twitter.com/zKls7e3Hfn
That comment described expectations before the decision. The chart outlook now depends on what prices do at the boundaries directly ahead of them.
What you'll learn 👉
Gold Price Is Climbing Toward the Top of Its Range
A look at the gold chart shows a descending range that began at the start of September. The upper boundary has acted as resistance, and the lower boundary has acted as support. Gold has continued to move between those lines as the range has headed lower.
Gold touched the bottom of the range on September 16. Since then, the price has turned upward and is aiming for the top again. That puts the area around $4,350 in focus today.
This rise is the part of the pattern that could look encouraging at first. Gold has bounced from support, and another trip toward the upper boundary is possible. The trouble is that the top of the range has stopped the price before. Unless gold gets past that boundary, the current move could become one more bounce inside the same descending pattern.
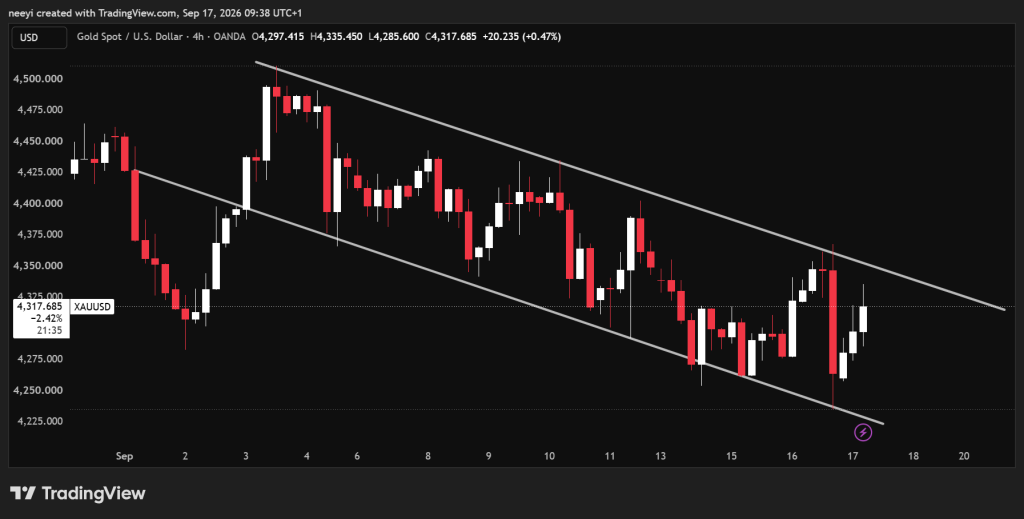
A move to $4,350 would therefore be a test, not proof that gold has broken free. If resistance holds again, gold could turn lower tomorrow and form a new bottom below $4,230 this week. That would extend the sequence of moves between the range’s upper and lower boundaries.
Gold also has a chance to challenge that outlook. If the price moves above the top of the range and stays there, the resistance that has guided this month’s decline would no longer be holding. Until that happens, the chart leaves open the possibility that today’s climb ends with another drop.
Silver Price Is Nearing a Resistance Line That Has Held Since August
Silver is rising toward its own test near $64. Its price has been moving inside a descending wedge since August, with resistance along the top and support along the bottom. Silver has headed lower within that pattern, and the space between the 2 boundaries has become narrower.
The current move is taking silver back toward the wedge’s upper boundary. That makes $64 the level to watch. If the price reaches that area and resistance holds, silver could turn down again.
The possible decline is substantial enough to matter for this week’s outlook. Silver could move toward $62 or even $61 if it fails at the top of the wedge. Those are possible levels within the chart pattern, not guaranteed prices.
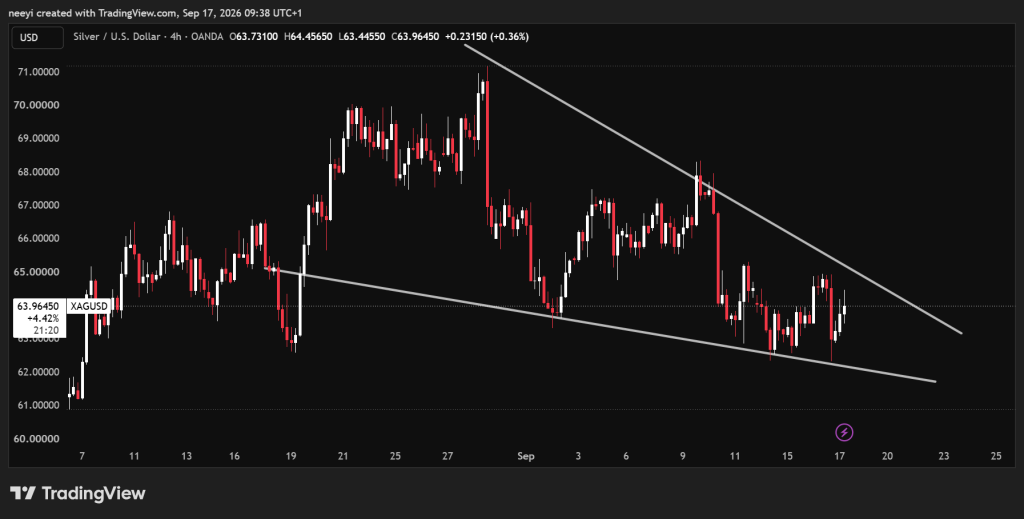
Silver’s narrowing wedge also makes the response near $64 useful. A rejection would keep the recent pattern intact. A move above the upper boundary that holds would challenge it. Silver has not settled that question simply by rising toward resistance.
Gold and silver are therefore at similar points in their respective patterns. Both have moved away from lower support, and both are heading toward upper resistance. Their charts leave room for more upside during the current climb, but they also show where another decline could begin.
Read Also: CLARITY Act Stalls: XRP Community Outlines Five Issues Holding Up Crypto Legislation
Thursday’s US Data Could Test Both Metals Again
The calendar gives gold and silver another event to navigate after the Fed decision. MCO News listed several US reports due on Thursday, September 17. It identified labor and manufacturing data as the main macro focus, with housing figures offering more detail on the economy.
US macro events to watch 🇺🇸
— MCO News (@MCO_News) September 17, 2026
Thursday
Philly Fed Manufacturing Index (forecast: 31.3)
A timely read on manufacturing conditions. Markets will watch for signs of changing business activity and price pressures.
Initial Jobless Claims (forecast: 207K)
One of the fastest labor… pic.twitter.com/w87Gm247kk
The Philly Fed Manufacturing Index has a forecast of 31.3, and Initial Jobless Claims have a forecast of 207,000. Building Permits are forecast at 1.40 million, Housing Starts at 1.32 million, and Pending Home Sales at negative 0.2%. MCO News also listed a forecast increase of 49 billion for Natural Gas Storage, a report more relevant to energy markets.
Those figures are forecasts rather than released results. Their value for this outlook lies in whether the actual data gives gold and silver enough of a push to get through resistance, or whether both prices turn lower once they reach it.
FAQs
Subscribe to our YouTube channel for daily crypto updates, market insights, and expert analysis.