
Gold is trading near $4,125.03 at press time, with prices still under pressure after another difficult stretch for the precious metal.
Yet one of gold’s strongest long-term demand sources has not disappeared.
The Kobeissi Letter reported that global central banks acquired another 39 tonnes of gold in August, marking a fifth consecutive month of purchases. China once again led the buying as governments continued adding bullion to their reserves despite the recent weakness in gold prices.
What you'll learn 👉
Central Banks Keep Accumulating Gold
Central banks purchased 39 tonnes in August following 23 tonnes in July and 52 tonnes in June, based on the data shared by Kobeissi.
The monthly chart shows how consistent the buying has become.
After reported net selling of 20 tonnes in March, purchases returned strongly:
| Month | Reported gold purchases |
|---|---|
| April | 25 tonnes |
| May | 44 tonnes |
| June | 52 tonnes |
| July | 23 tonnes |
| August | 39 tonnes |
That gives gold five consecutive positive months based on the chart.
China was the biggest buyer in August, adding another 20 tonnes.
Kobeissi reported that China’s purchases have now reached 80 tonnes for 2026, taking official reserves to a record 2,387 tonnes. Gold now represents about 9% of China’s total foreign exchange reserves.
Poland has also remained an important buyer.
The country added 8 tonnes in August, taking its 2026 purchases to 98 tonnes and total holdings to a record 648 tonnes.
Kobeissi puts overall central-bank gold acquisitions at 170 tonnes so far this year.
The broader message is clear: governments have continued adding gold even after one of the largest gold rallies in years.BREAKING: Global central banks acquired +39 tonnes of gold in August, marking their 5th consecutive monthly purchase. This follows +23 tonnes in July and +52 tonnes in June. China again led demand, adding +20 tonnes and bringing its year-to-date purchases to +80 tonnes. China’s official gold reserves have now risen to a record 2,387 tonnes, or 9% of its total FX reserves. Furthermore, Poland bought +8 tonnes, lifting its year-to-date purchases to +98 tonnes and total gold reserves to a record 648 tonnes. So far in 2026, central banks have acquired +170 tonnes of gold. Central banks continue to aggressively accumulate gold.
— The Kobeissi Letter (@KobeissiLetter) October 7, 2026
What the Central Bank Chart Shows
The longer-term chart also puts August's 39 tonnes into perspective.
Monthly buying has been volatile since the beginning of 2024, ranging from a 20-tonne decline in March 2026 to purchases as large as 66 tonnes in November 2024.
August was therefore not an extraordinary month by itself.
The more interesting development is the consistency.
April, May, June, July and August all posted positive numbers. June's 52-tonne purchase was the strongest month of 2026 so far, followed by May at 44 tonnes and February at 40 tonnes.
This steady demand provides an underlying source of support for gold even when short-term traders are selling.
Central banks also tend to operate on a much longer horizon than speculative investors, meaning their purchases are generally less sensitive to short-term price fluctuations.
Read also: “They Crashed Gold Price on Purpose” – The Real Plan Behind the Debt Crisis
Gold Price Remains Under Pressure
I had a look at the Gold chart this morning too.
Gold price currently trades around $4,125 after falling from the late-August recovery above $4,600.
Since that peak, price has produced a series of lower highs and has gradually moved back toward the $4,100 region.
The first important support is around $4,100 to $4,120.
This area is being tested now and has already attracted buyers several times. If it fails, the next major zone is around $4,000 to $4,050.
Below $4,000, the technical picture would deteriorate further and could open the door toward the $3,900 region.
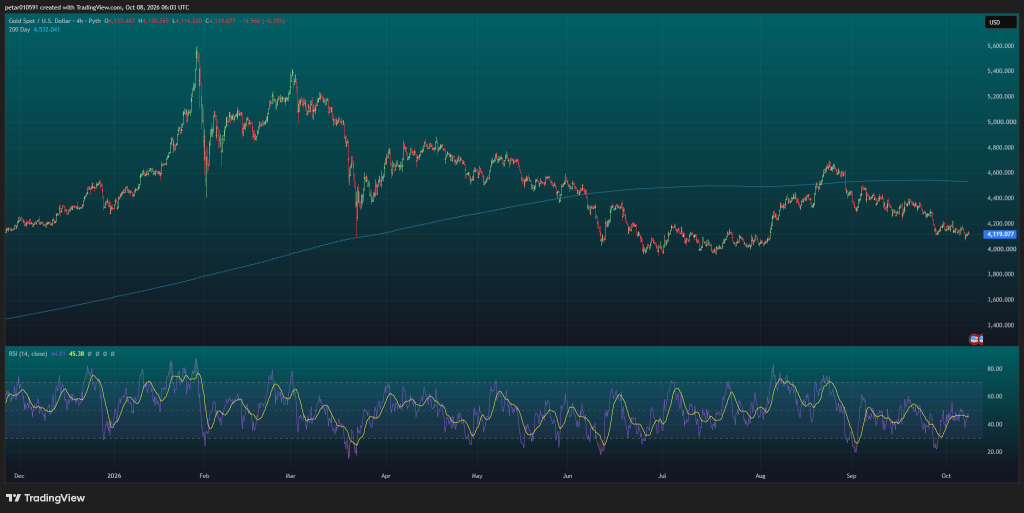
On the upside, $4,200 is the first resistance bulls need to recover.
Above that, the $4,300 to $4,400 region becomes important. The 200-day moving average shown on the chart is much higher near $4,532, making it a major longer-term resistance level.
RSI Shows Weak Momentum, But Gold Is Not Oversold
The chart's RSI shows around 44.8, with its moving average near 45.4.
That puts momentum below the neutral 50 level but still well above oversold territory near 30.
This is important because gold does not yet have the kind of deeply oversold reading that would automatically make a strong rebound more likely.
Price can still move lower without pushing RSI into historically extreme territory.
At the same time, RSI has started stabilizing after falling toward the lower part of its recent range.
If gold holds $4,100 and RSI moves back above 50, that would improve the short-term setup.
Gold Price Outlook
Gold is now between strong long-term demand and weak short-term price action.
The central-bank story remains constructive. China, Poland and other governments continue increasing their reserves, giving the market a persistent source of physical demand.
The chart, however, still favors caution.
A hold above $4,100 could produce another attempt at $4,200, followed by $4,300 if momentum improves.
A loss of $4,100 would put the $4,000 to $4,050 region into focus.
For more financial news and price predictions, click here.
Subscribe to our YouTube channel for daily crypto updates, market insights, and expert analysis.