Dogecoin About To Send Price Ballistic If This One Key Metric Crosses Decisive Threshold, Warns Analyst
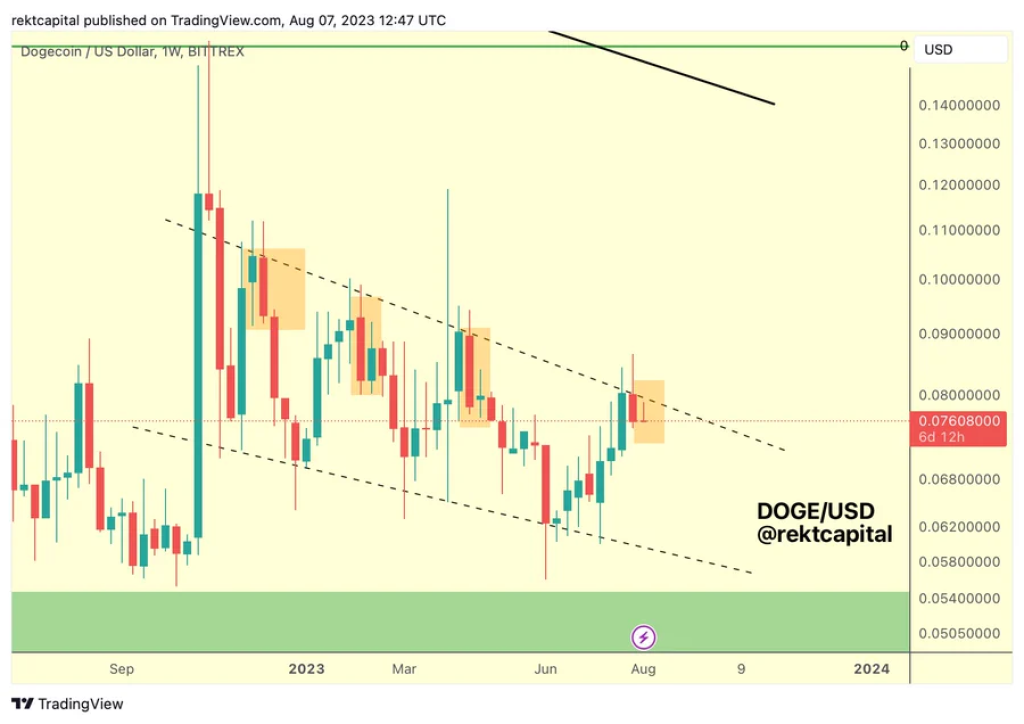
The well-known technical analyst, Rekt Capital, recently shared his insights on Twitter about the potential price behavior of Dogecoin ($DOGE). He suggested that if Dogecoin experiences a small relief rally this week, it would mirror the price behavior seen in previous retracements within the same pattern when Dogecoin faced resistance.
According to recent data from, altFINS, there has been a bullish breakout from a Falling Wedge pattern for Dogecoin. This event is often interpreted as a sign that buyers have successfully absorbed the supply from sellers, potentially leading to a reversal in market trends.
The confirmation of this shift came when the price broke above the $0.07 resistance level and surpassed the 200-day moving average, which stood at $0.08. Market watchers are now anticipating that the price could revisit the $0.10 resistance level in the near future.
Doge2014 raises 500K in days celebrating Dogecoin. Make potentially big profits and get in on exclusive airdrop!
Show more +The Falling Wedge is a pattern that typically results in a bullish breakout. When the price breaks the upper trend line, it is expected to trend higher. Emerging patterns, which appear before a breakout occurs, can be traded by swing traders between the convergence lines. However, the majority of traders prefer to wait for a completed pattern with a breakout before placing a BUY order.
At present, the market trend appears to be neutral on a short-term basis. However, on a medium-term basis, there is an uptrend, while a downtrend is observed on a long-term basis.
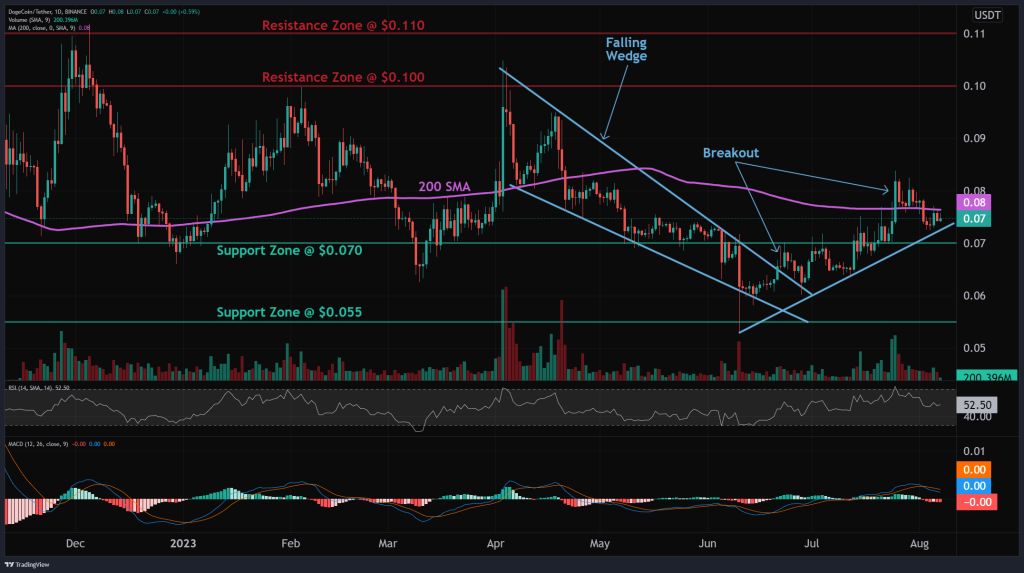
The momentum in the market is mixed. The Moving Average Convergence Divergence (MACD) line is currently below the MACD signal line, indicating a bearish trend. However, the Relative Strength Index (RSI) is hovering around 50, which is generally considered neutral.
In terms of support and resistance levels, the nearest support zone is at $0.070, which was the previous resistance level. Following this, the next support level is at $0.055. On the other hand, the nearest resistance zone is at $0.010, followed by $0.110.
In conclusion, the market is showing signs of a potential reversal, with the bullish breakout from the Falling Wedge pattern being a key indicator. Traders and investors are advised to keep a close eye on these developments as they navigate their investment strategies.