
Three major crypto assets are at critical points as May 2, 2026 brings fresh price action and some clear technical setups worth watching. XRP price is stuck in a tight range that could break either way, Kaspa (KAS) is sliding lower inside a recognisable pattern.
Also, Injective (INJ) is charging toward a resistance level that has already pushed it back twice. Each of these assets tells a different story today, and the charts are giving enough clues to map out what could happen next.
What you'll learn 👉
XRP Price Is Forming An Inverted Head And Shoulder Pattern Inside A Tight Range
XRP price held to the bullish prediction from yesterday, trading between $1.37 and $1.39 as expected. The price was unable to break above the upper boundary of that range to form new highs, which keeps the outlook largely unchanged.
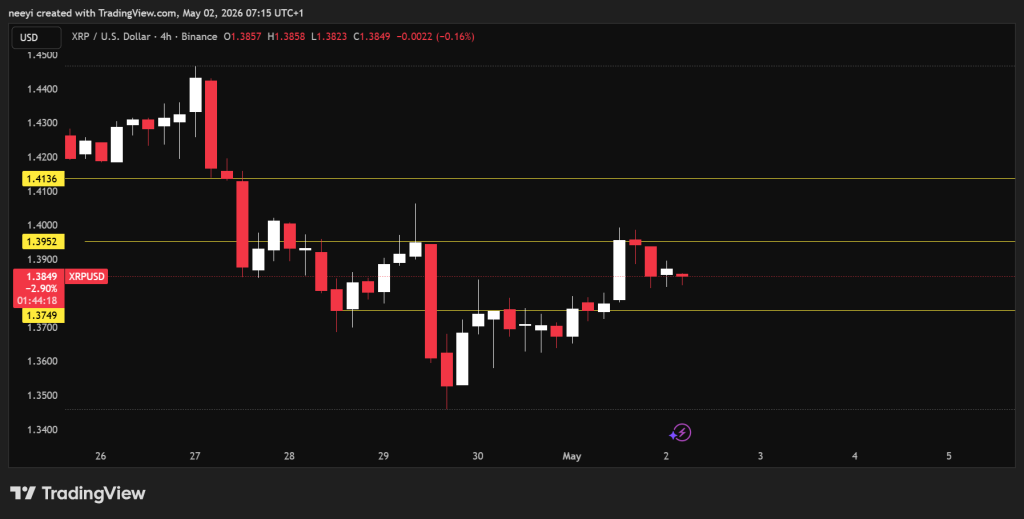
What makes this interesting is that XRP price is now forming what looks like an inverted head and shoulder pattern. That kind of formation usually points to a potential recovery move, though confirmation still requires a proper break above the neckline. Trading could stay inside the $1.37 to $1.39 zone again today, and the overall picture mirrors yesterday’s outlook.
A break below $1.37 would put downside pressure on XRP price and could push it toward $1.36, or even $1.35 if selling intensifies. A break above $1.395, which is slightly higher than yesterday’s resistance, would open the door toward the $1.40 zone today.
The indicator readings from the 5-hour chart on Investing.com show a mixed picture with the price sitting in neutral territory for now.
| Name | Value | Action |
|---|---|---|
| RSI(14) | 46.878 | Neutral |
| STOCH(9,6) | 71.012 | Buy |
| MACD(12,26) | -0.007 | Sell |
| ADX(14) | 25.611 | Sell |
| Ultimate Oscillator | 60.644 | Buy |
| Bull/Bear Power(13) | 0.0008 | Buy |
The RSI at 46.878 is neutral, sitting below the 50 midpoint, which means there is no strong directional momentum right now. The STOCH reading of 71.012 leans toward buyers, and the Ultimate Oscillator at 60.644 also supports that lean. The Bull/Bear Power reading is technically a buy at 0.0008, though the margin is very thin.
On the sell side, the MACD at -0.007 is slightly negative, which points to mild bearish pressure. The ADX at 25.611 also reads sell, and an ADX below 25 typically indicates weak trend strength, which explains why XRP price is not making a decisive move in either direction. Taken together, the indicators reflect the same mixed picture that the price chart does.
XRP Price Prediction for Today, May 2
The bullish scenario requires a clean break above $1.395. If that happens, the path opens toward $1.40 today, and the inverted head and shoulder pattern would start to deliver on its potential.
The neutral scenario is the most likely outcome given the mixed indicators. XRP price could continue trading between $1.374 and $1.395, consolidating inside the pattern without making a decisive move. The inverted head and shoulder formation supports this kind of tight trading while the market makes up its mind.
The bearish scenario unfolds if the price breaks below $1.375. A move below that level could drag XRP price down toward $1.36 today.
Kaspa (KAS) Price Continues To Slide Lower Inside A Triangle Formation
Kaspa (KAS) price has continued its descent, forming lower lows and lower highs over recent sessions. Zooming out to the bigger picture, KAS is carving out a triangle pattern where each major bounce reaches a slightly higher level than the one before it.
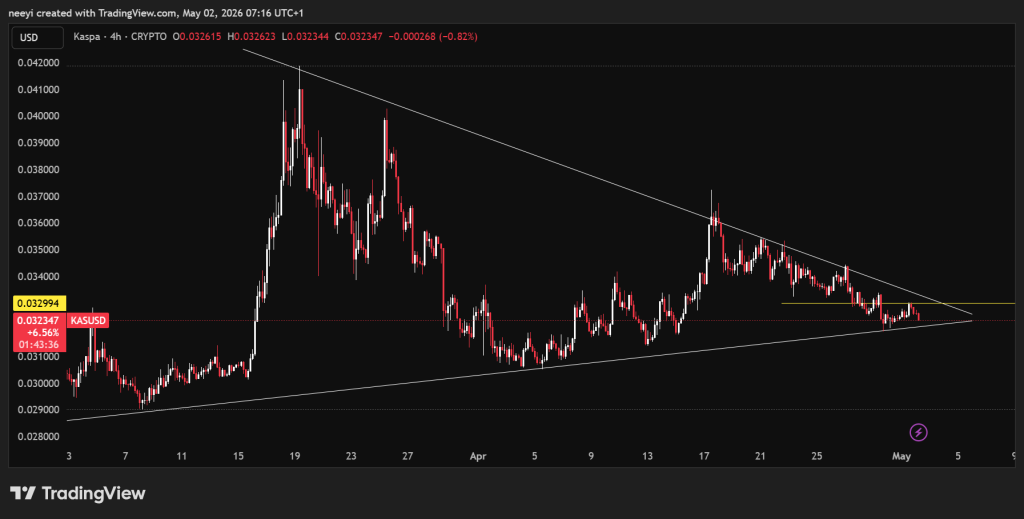
The current price sits around $0.0324, and with the ongoing structure, the possibility of touching $0.032 this weekend is a real one to watch.
The immediate support for KAS price is at $0.0323. A break below that level could send the price sliding toward $0.0322. The first major resistance stands at $0.0329, and that level looks likely to hold through today.
The RSI at 41.142 is below the 50 midpoint and reads as a sell, which is consistent with the downward price structure. The MACD is sitting exactly at 0, which signals no momentum in either direction, though it leans bearish.
| Name | Value | Action |
|---|---|---|
| RSI(14) | 41.142 | Sell |
| STOCH(9,6) | 57.703 | Buy |
| MACD(12,26) | 0 | Sell |
| ADX(14) | 26.097 | Sell |
| Ultimate Oscillator | 50.845 | Neutral |
| Bull/Bear Power(13) | -0.0011 | Sell |
The ADX at 26.097 reads sell, confirming that the current downtrend has some strength behind it even if it is not aggressive. The Bull/Bear Power at -0.0011 is technically in negative territory, which gives the bears a slight edge.
The STOCH at 57.703 is the only reading that leans toward buyers, and the Ultimate Oscillator at 50.845 is perfectly neutral. Overall, the indicator picture for Kaspa ranges from bearish to neutral today.
Kaspa (KAS) Price Prediction for Today, May 2
The neutral case assumes the $0.0323 support holds firm. If it does, KAS price could consolidate between that level and $0.0329 for the remainder of the day without making a big move in either direction.
The bearish case plays out if the price continues lower and breaks below $0.0323. That kind of move could open up new lows at $0.0322 or even $0.0321, which is where the triangle pattern structure would be expected to produce another bounce.
The bullish scenario is the least likely outcome today. A break above $0.0329 would be needed to flip the picture, and given the current metrics, only a major catalyst could push Kaspa above that resistance level today.
Injective (INJ) Price Approaches A Key Resistance After A 10% Move Higher
Injective (INJ) has had a strong run since the early hours of Friday, climbing more than 10% to reach its current price around $3.77. That kind of move draws attention, though the price is now approaching a level that has already turned it back twice, sitting around $3.84.
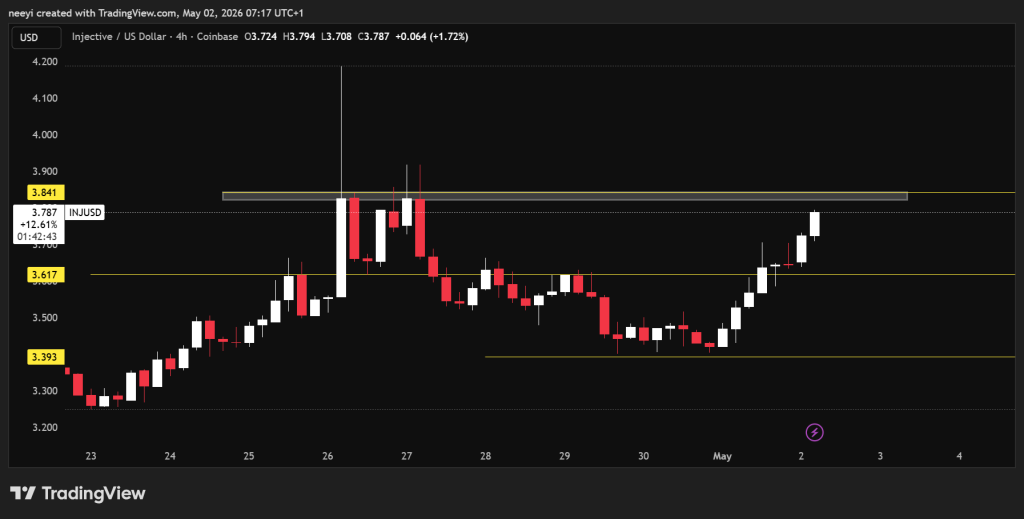
That resistance area is also likely where some traders who bought earlier in the move would look to take profits. Because of that, the $3.84 zone could be the point where the bullish momentum stalls, at least temporarily. If the resistance holds, some consolidation around that level is possible, along with a modest pullback, especially if the bears do not fully take over the tape.
A clean break above $3.84 would change the picture and could set up a move toward $3.90 or even $4.00 this weekend.
The RSI at 63.633 is comfortably above the 50 midpoint and firmly in buy territory. The MACD at 0.051 is positive and confirms that upward momentum is still present. The Ultimate Oscillator at 65.783 and the Bull/Bear Power at 0.276 both back the bullish reading.
| Name | Value | Action |
|---|---|---|
| RSI(14) | 63.633 | Buy |
| STOCHRSI(14) | 100 | Overbought |
| MACD(12,26) | 0.051 | Buy |
| ADX(14) | 24.486 | Neutral |
| Ultimate Oscillator | 65.783 | Buy |
| Bull/Bear Power(13) | 0.276 | Buy |
The ADX at 24.486 is neutral, which means the trend has not reached full strength yet, but it is developing. The one flag to keep an eye on is the STOCHRSI at 100, which is overbought.
That reading does not reverse a move on its own, but it does indicate that the price has moved a long way quickly and could be due for a pause or pullback.
Overall, the 5-hour chart reading on Investing.com comes out as a strong buy for INJ price today.
Injective (INJ) Price Prediction for Today, May 2
The bullish scenario for INJ price sees the $3.84 resistance break. If that happens, the next targets to watch are $3.90 and potentially $4.00 before the weekend closes. The indicators support this outcome, though the overbought STOCHRSI is a reminder that momentum can fade after a big move.
The neutral scenario assumes the resistance at $3.84 holds. Consolidation between the $3.80 and $3.60 levels would follow as the price digests the recent gains without giving up significant ground.
A deeper pullback forms the bearish scenario. If further profit taking kicks in around resistance, INJ price could slip toward $3.40. That kind of move would still leave the bigger trend intact, but it would erase a meaningful portion of the recent gains.
FAQs
Subscribe to our YouTube channel for daily crypto updates, market insights, and expert analysis.