
The crypto market dropped a little today, down half a percent. That pulls the whole market value to $2.2 trillion.
Two things are making people nervous. First, oil prices just jumped past $90 a barrel because things are heating up between Iran and the US. Second, there’s that CLARITY Act floating around in Washington, and nobody knows what’s going to happen with it.
So everyone’s playing it safe for now. But today’s trading could go either way. By the end of the day, we’ll know if buyers are ready to step back in or if sellers are going to keep pushing prices down.
What you'll learn 👉
XRP Price Struggles Below $1.10 as Momentum Remains Weak
The XRP price trades at $1.08, down 0.7% over the past 24 hours. We pulled up the chart and took a look.
We saw that the price tried to push past that $1.16 mark from early July, but it couldn’t stay there. It fell back down, and ever since, the whole thing has felt heavy. There’s no real push upward. Just a slow grind lower.
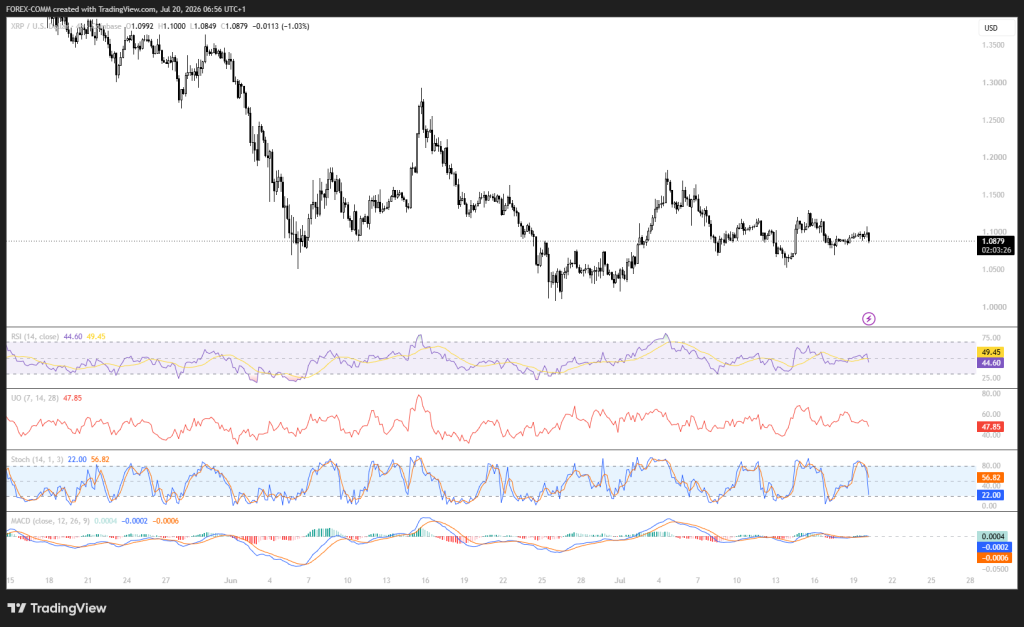
Price has spent the past week moving sideways between roughly $1.05 and $1.10, showing buyers continue defending support but lack the strength to force a breakout. Immediate resistance remains around $1.10-$1.12, with stronger resistance near $1.15.
We looked at the numbers. The RSI is at 44.31, that’s below the halfway mark, so bearish. The Stochastic oscillator dropped to 20.80, which is getting low enough that sometimes prices bounce back from there.
The Ultimate Oscillator came in at 47.52. That tells us buyers aren’t really showing up. And the MACD? It’s at 0.0004. Basically flat. The selling pressure is dying down, but there’s nothing yet that says buyers are taking over. So we’re stuck in this in-between place. Not falling hard, not rising either. Just waiting.
| Indicator | Reading | Interpretation |
|---|---|---|
| RSI (14) | 44.31 | Weak momentum below neutral |
| STOCH (9,6) | 20.80 | Near oversold conditions |
| Ultimate Oscillator | 47.52 | Buyers remain slightly weaker |
| MACD | 0.0004 | Momentum is stabilizing |
What’s Driving the XRP Price Today?
Institutional interest received a boost after T. Rowe Price introduced the actively managed TKNZ multi-token spot crypto ETF, allocating about 9.37% of its portfolio to XRP. Since the fund holds the underlying assets directly, every portfolio allocation requires the purchase and custody of XRP, giving the asset another institutional demand channel.
Political uncertainty continues to limit upside. The CLARITY Act faces a key hurdle after Senator Elizabeth Warren requested President Donald Trump disclose crypto-related earnings before July 23, with Senator Cynthia Lummis warning that failure to pass the bill during this legislative window could delay comprehensive crypto regulation until 2030.
XRP Price Prediction for Today
Bullish Prediction:
A move above $1.10 could lift the XRP price toward $1.12, with $1.15 becoming the next upside target.
Neutral Prediction:
Trading between $1.05 and $1.10 would keep consolidation intact.
Bearish Prediction:
Losing $1.05 could expose the XRP price to $1.02.
Solana Price Holds Support as ETF Optimism Counters Market Weakness
The Solana price trades at $75.86, down 0.62% today. We had a look at the Solana chart and found buyers continue defending the $74-$75 region after the correction from the July high near $82.
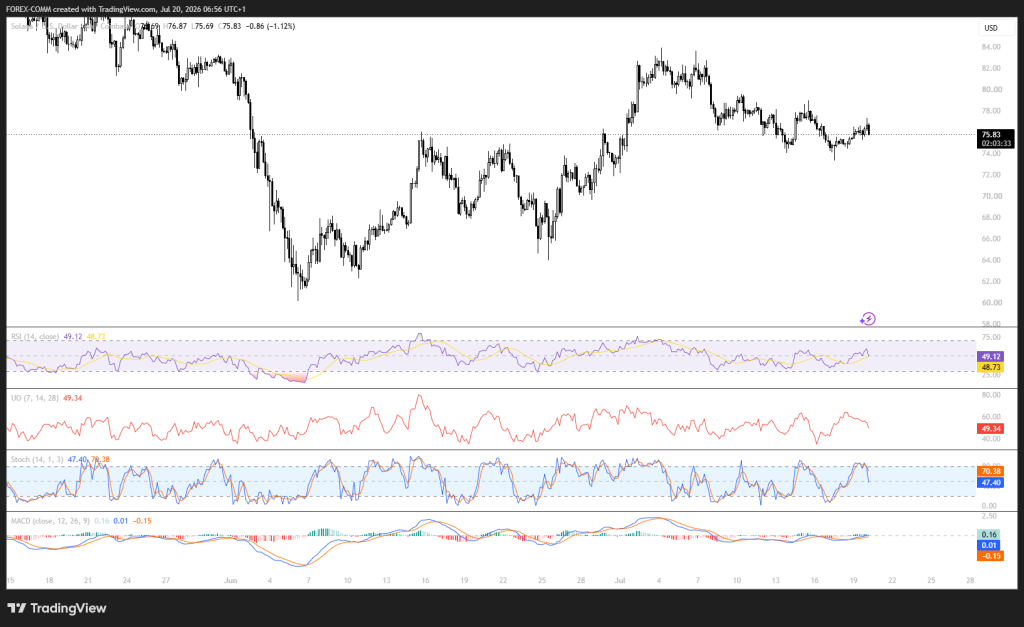
Price has begun printing higher lows over the past several sessions, although repeated rejection around $77-$78 shows sellers remain active. A break above that resistance would improve the short-term outlook considerably.
Momentum remains balanced. RSI is at 49.22. Right in the middle. Neither hot nor cold. Stochastic is 49.10 too. Same story, buyers aren’t winning, sellers aren’t winning. It’s a draw. Ultimate Oscillator? 49.70. More of the same. Nobody’s committing to anything.
But the MACD is still positive at 0.16. That means the bulls haven’t totally packed up and left. There’s still some life in there, even if everything else looks flat.
| Indicator | Reading | Interpretation |
|---|---|---|
| RSI (14) | 49.22 | Neutral momentum |
| STOCH (9,6) | 49.10 | Balanced conditions |
| Ultimate Oscillator | 49.70 | Buying and selling pressure remain even |
| MACD | 0.16 | Mild bullish momentum |
What’s Driving the Solana Price Today?
Solana’s proposed Governance Proposal framework introduces stricter voting rules for strategic decisions. Validators must stake at least 100,000 SOL to submit proposals, proposals need support from 15% of active stake before advancing, and final approval requires a two-thirds majority, creating a more structured governance process.
Institutional access also expanded after Morgan Stanley’s E*Trade added Solana trading to its platform. The listing comes as competition among issuers seeking approval for spot Solana ETFs continues to intensify, reinforcing institutional interest even before SEC approval arrives.
Related Solana News: Is Kaspa Better Than Solana for a 5-Year Investment?
Solana Price Prediction for Today
Bullish Prediction:
A break above $77 could push the Solana price toward $79, followed by $82.
Neutral Prediction:
Holding between $74 and $77 would keep the range intact.
Bearish Prediction:
A close below $74 could send the Solana price toward $72.
Ethereum Price Holds Above $1,850 Despite Mixed Momentum
The Ethereum price trades at $1,855.91, down 0.65% over the past 24 hours. We pulled up the chart and took a look. We saw buyers stepped in hard when the price dropped to that $1,760 to $1,800 zone a couple weeks back.
They held that line. And since then, the whole recovery off the June low is still alive. It’s not broken yet. So, today’s a small dip, but that defense down below still matters.
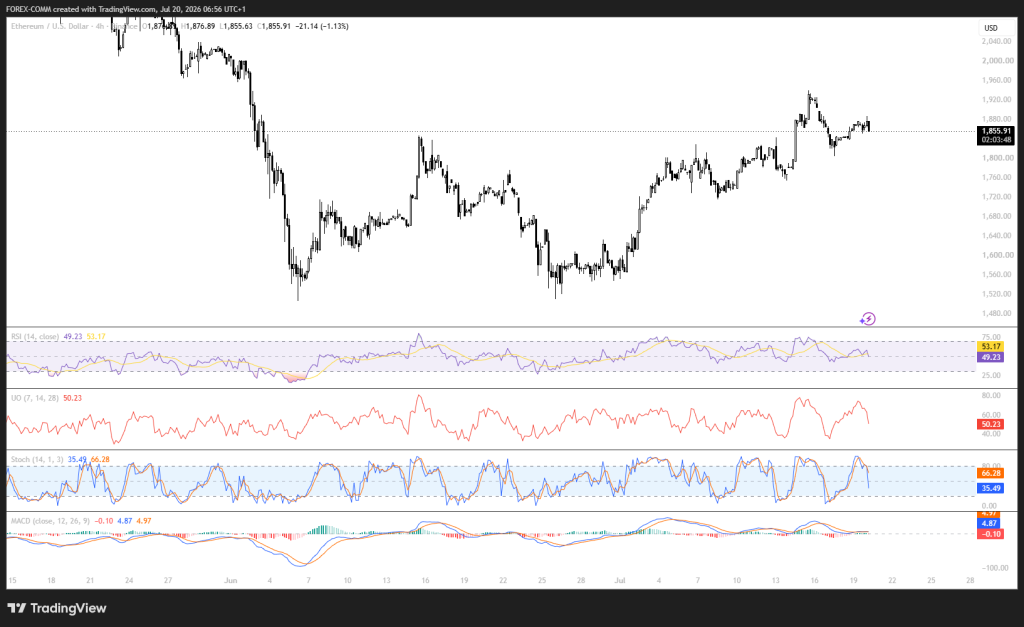
But the candles lately are losing steam. That $1,900 level above is acting like a ceiling. Price is flattening out again, just chopping around. Still, as long as the Ethereum price stays above $1,850, buyers are in a decent spot heading into today.
The indicators are all over the place though. RSI is 49.23, basically dead center. Stochastic fell to 35.49, so buying pressure is cooling off, but it hasn’t dropped low enough to say “oversold.”
Ultimate Oscillator is 50.23. That’s perfectly balanced. Neither side is pushing hard. And the MACD? Positive at 4.87. That’s the one thing leaning bullish. Buyers have a tiny edge, but it’s not much. Just a whisper.
| Indicator | Reading | Interpretation |
|---|---|---|
| RSI (14) | 49.23 | Neutral momentum |
| STOCH (9,6) | 35.49 | Buying momentum has cooled |
| Ultimate Oscillator | 50.23 | Balanced market conditions |
| MACD | 4.87 | Bullish momentum remains positive |
What’s Driving the Ethereum Price Today?
Last week, spot Ethereum ETFs pulled in $105.4 million. The week before that, they added $84.4 million.
That might not sound like much, but here’s the thing, before those two weeks, money had been leaving those funds for eight straight weeks. Over $1.1 billion gone. So people were selling, selling, selling.
Now that’s flipped. Investors are buying the dips instead of running from them. BlackRock did most of the heavy lifting. Their main Ethereum fund brought in about $139.3 million across five trading days. And since they launched that thing, they’ve piled up more than $11.3 billion in total.
Ethereum also outperformed Bitcoin in weekly ETF demand, attracting $105.4 million versus Bitcoin’s $75.7 million, even though Bitcoin continues holding much larger ETF assets.
Ethereum Price Prediction for Today
Bullish Prediction:
A move above $1,880 could lift the Ethereum price toward $1,920, with $1,950 becoming the next target.
Neutral Prediction:
Holding between $1,820 and $1,880 would keep Ethereum inside its consolidation range.
Bearish Prediction:
Losing $1,820 could open the door toward $1,780.
Frequently Asked Questions
Subscribe to our YouTube channel for daily crypto updates, market insights, and expert analysis.