


The week is off to a rough start. The whole crypto market lost 1.43% in the last day, bringing the total value down to $2.16 trillion.
Everyone is watching what’s happening with the U.S. and Iran. More strikes happened over the weekend, and that has people worried about oil prices going up, inflation sticking around, and the Fed keeping rates high. Because of that fear, crypto is selling off right alongside stocks and other risky bets.
It’s been brutal for Bitcoin traders. Liquidations shot up 258%, wiping out $58 million in positions. On top of that, spot Bitcoin ETFs bled another $95 million as money keeps heading for the exit.
Today is big. If buyers don’t show up soon, this drop could keep going all week.
What you'll learn 👉
XRP Price Trades Near $1.07 as Institutional Adoption Continues to Grow
XRP is going for $1.07 right now. That’s down about one and a half percent from this time yesterday.
We pulled up the chart to see what’s going on. What we found is pretty clear, XRP has been stuck in a downward slide since the start of June. That bigger drop is still running things, and today’s move fits right in with it.
Buyers defended the area just above $1.03 last week, but every recovery attempt has produced a lower high, showing that sellers remain in control.
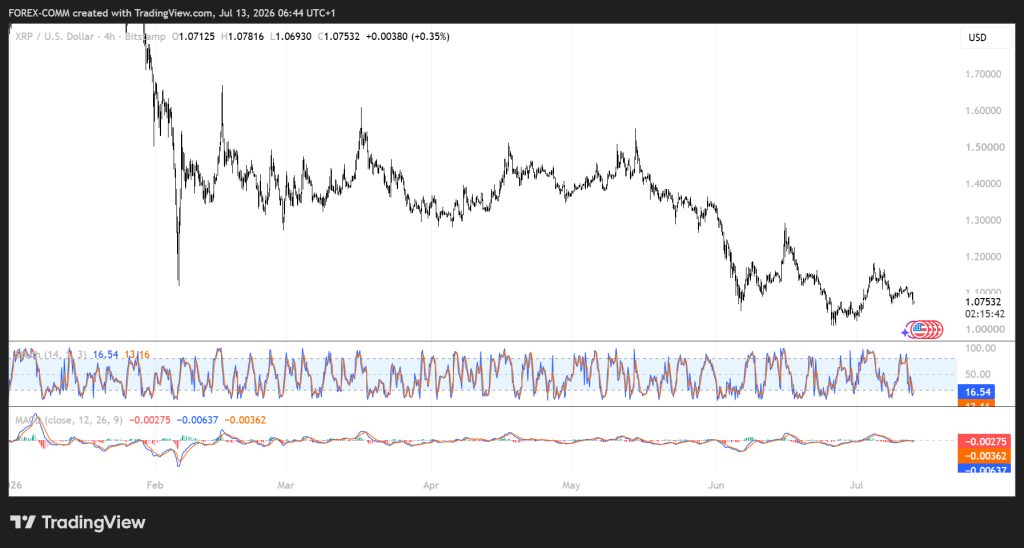
The RSI is down at 36.88. That’s getting close to the oversold line, but it hasn’t flipped yet. No clear sign that buyers are about to step in.
Then you’ve got the Stochastic at 16.19. That’s low. Real low. Sellers have been in control, and they’re not letting up. The Ultimate Oscillator is at 39.69. That’s another red flag, nobody’s really buying.
And the MACD is negative at -0.00638. That’s the final piece. It tells you the downward pressure is still there, plain and simple.
| Indicator Metric | Reading | Interpretation |
|---|---|---|
| RSI (14) | 36.88 | Near oversold, sellers still lead |
| STOCH (9,6) | 16.19 | Oversold, bounce possible |
| Ultimate Oscillator | 39.69 | Weak buying momentum |
| MACD | -0.00638 | Bearish momentum remains |
Key Factors Pushing the XRP Price Presently
The XRP Ledger continues to strengthen its position in the real-world asset market. Tokenized assets on XRPL have grown from about $991 million at the start of the year to nearly $4 billion across more than 500 products, with tokenized U.S. Treasuries leading adoption.
Institutional firms including JPMorgan and Mastercard have also integrated Treasury settlement flows on XRPL that complete in less than five seconds.
Institutional interest also received another boost after Grayscale classified Ripple’s XRP as a core “global payments” asset in its latest digital asset framework. Also, Ripple-backed Evernorth expanded into Japan with support from SBI Holdings, targeting institutional adoption in one of crypto’s most regulated markets.
XRP Price Prediction for Today
Bullish Path:
For XRP to turn things around, the first thing we need to see is a push back above $1.10.
If it can get past that, then $1.13 comes into play. And from there, $1.16 is the next real target on the way up.
Neutral Prediction:
If buyers defend $1.05, the XRP price could trade between $1.05 and $1.10 for most of today’s session.
Bearish Case:
Losing $1.05 would expose the recent support near $1.03. A break below that area could push the XRP price back toward the $1.00 psychological level.
Solana Price Pulls Back After Failing to Hold Above $80
The SOL price is trading at $76.30, down 0.57% over the last 24 hours. We had a look at the chart and found the recovery from June’s low near $61 has started to lose momentum. The price was rejected around $81, and sellers have pushed SOL back into the mid-$70 range, forming another lower high.
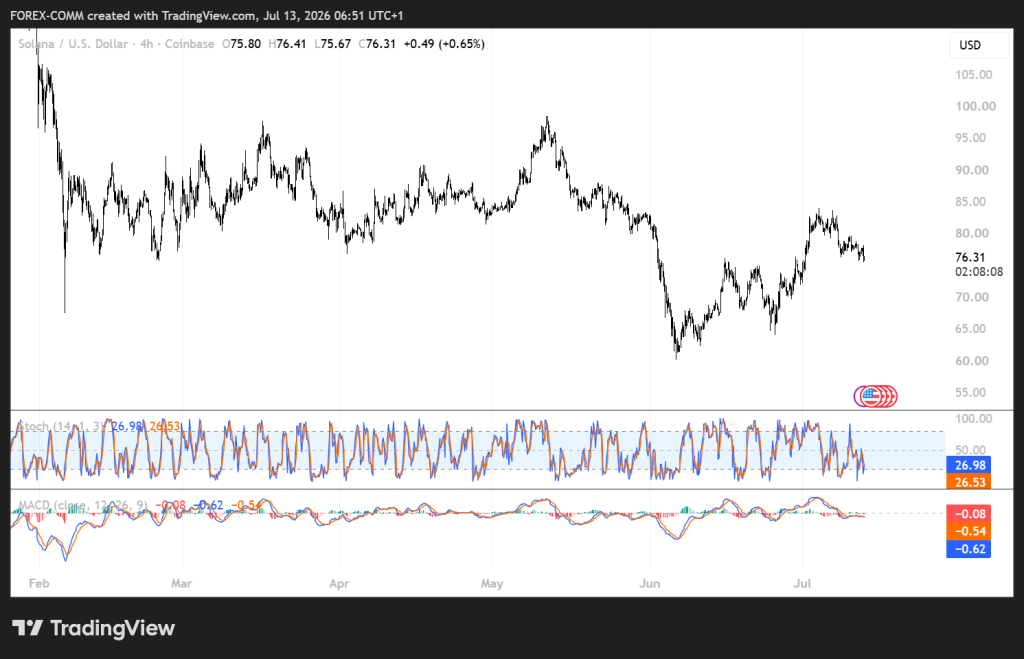
Here’s what the indicators are showing for Solana. The RSI is 40.29. That tells us sellers are still in charge. No question about it.
The Stochastic is at 27.86. That’s getting down near oversold levels, but buyers haven’t stepped in to prove anything yet. No reversal signal so far. The Ultimate Oscillator is 47.80, right around neutral. Not much conviction on either side there.
And the MACD is negative, at -0.62. That’s the final confirmation: the pressure is still coming from sellers.
| Indicator Metric | Reading | Interpretation |
|---|---|---|
| RSI (14) | 40.29 | Sellers hold a small advantage |
| STOCH (9,6) | 27.86 | Near oversold territory |
| Ultimate Oscillator | 47.80 | Neutral momentum |
| MACD | -0.62 | Bearish momentum |
Key Factors Pushing the Solana Price Presently
Solana continues to post strong network growth despite today’s market weakness. The network processed more than 1 billion non-vote transactions during the week ending July 6, while weekly active wallet addresses climbed from 16.8 million to 29.7 million in only two weeks. Investors are also watching the planned launch of Open USD (OUSD), backed by a consortium that includes BlackRock.
Then there’s the bad news. A wallet got hit for $14 million. Turns out it was a stolen private key, not a hole in Solana’s code. But that didn’t matter to traders, it shook confidence anyway.
On top of that, the bigger picture isn’t helping. The U.S.-Iran situation has everyone on edge, and Bitcoin is dragging everything down with it. Solana got pulled right along.
Related Solana News: Massive Solana Whale May Be Compromised: This Level Could Decide SOL’s Move to $90
Solana Price Prediction for Today
Bullish Case:
The Solana price needs to move back above $78 first. A successful breakout could target $80, with $82 becoming the next resistance.
Neutral Path:
Holding above $75 could keep the Solana price trading between $75 and $78 through today’s session.
Bearish Prediction:
A drop below $75 could send the SOL price toward $72, and losing that level would expose the June support around $70.
Ethereum Price Rebounds From June Lows as Institutional Demand Grows
Ethereum is changing hands at $1,776. That’s a 1.5% drop since yesterday.
We pulled up the chart to see what’s actually happening. The good news is ETH has been climbing back from that June low around $1,520. It even poked above $1,800 for a bit, but ran into a wall there and got pushed back.
Now it’s in this $1,770 to $1,780 zone. You can feel the tug-of-war happening right here, buyers trying to hold the line, sellers trying to push it lower.
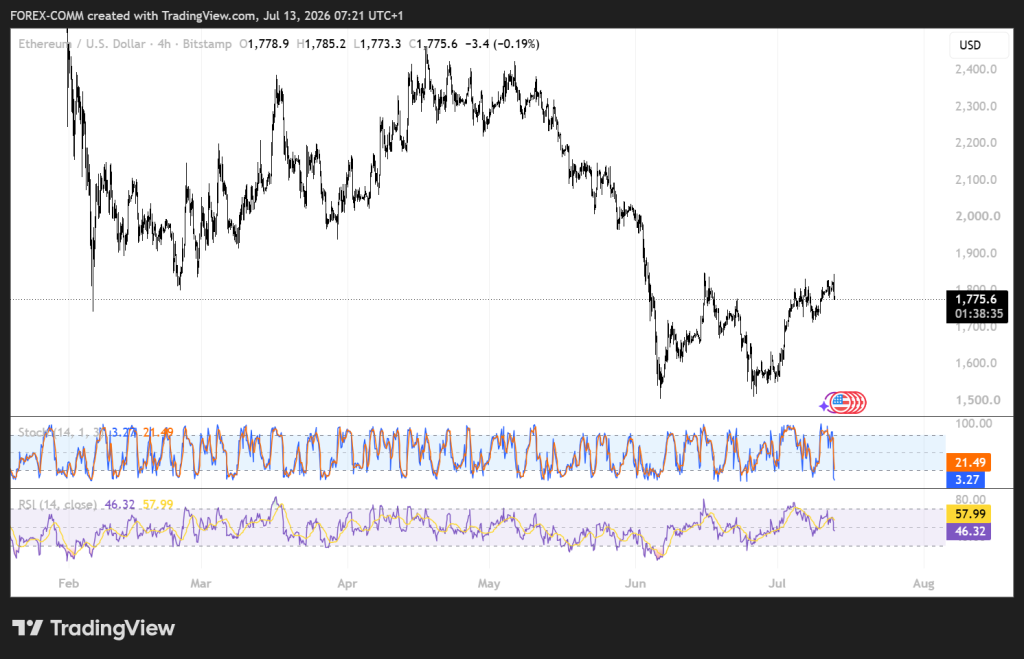
Here’s what the numbers are telling us about Ethereum right now. The RSI is at 46.39. That’s pretty much middle ground, not too hot, not too cold. But if you had to pick a side, it leans just a little toward the sellers.
Then there’s the Stochastic, down at 3.67. That’s deep in oversold territory. When it gets this low, it often means a bounce could be coming, if buyers finally decide to show up.
The Ultimate Oscillator is 37.84. That’s another sign that buying interest is weak. Not a lot of people are jumping in.
But here’s the twist. The MACD is positive at 8.1. That’s a small green flag. It means bullish momentum is starting to creep back in, even with today’s dip. So the picture is mixed, sellers are in control for now, but the tide could be turning.
| Indicator Metric | Reading | Interpretation |
|---|---|---|
| RSI (14) | 46.39 | Slight bearish bias |
| STOCH (9,6) | 3.67 | Weak buying momentum |
| Ultimate Oscillator | 37.84 | Buyers remain in control |
| MACD | 8.1 | Bullish momentum is improving |
Key Factors Pushing the Ethereum Price Presently
The broader crypto market is going through a leverage reset, and Ethereum has been caught in the move. The average crypto funding rate dropped 61.34% to +0.002264% over the past 24 hours, while Bitcoin liquidations climbed 192.87% to $55.27 million, pointing to heavy long liquidations across the market. That has added selling pressure to the Ethereum price, even as leverage becomes healthier.
Institutional demand continues to support Ethereum’s long-term outlook. Bitmine now holds 5.74 million ETH, equal to about 4.8% of Ethereum’s 120.7 million supply, after adding more than 82,000 ETH through recent purchases.
Robinhood also launched its Layer-2 network on Arbitrum Orbit using ETH as the gas token, with more than $141 million bridged onto the chain and $877.56 million in 24-hour DEX volume, creating direct demand for ETH across the network.
Ethereum Price Prediction for Today
Bullish Path:
The ETH price needs to reclaim $1,800 first. A move above that level could target $1,850, with $1,900 becoming the next resistance.
Neutral Prediction:
If buyers defend $1,750, the Ethereum price could consolidate between $1,750 and $1,800 for most of today’s session.
Bearish Case:
A break below $1,750 could send the Ethereum price back toward $1,700. Losing that support would expose the June recovery zone near $1,650.
Frequently Asked Questions
Subscribe to our YouTube channel for daily crypto updates, market insights, and expert analysis.






