
Ethereum, XRP, and Solana enter August 27 near price levels that could decide how the rest of the day develops. All 3 cryptocurrencies have spent much of their recent trading inside defined ranges, but pressure is starting to build near important boundaries.
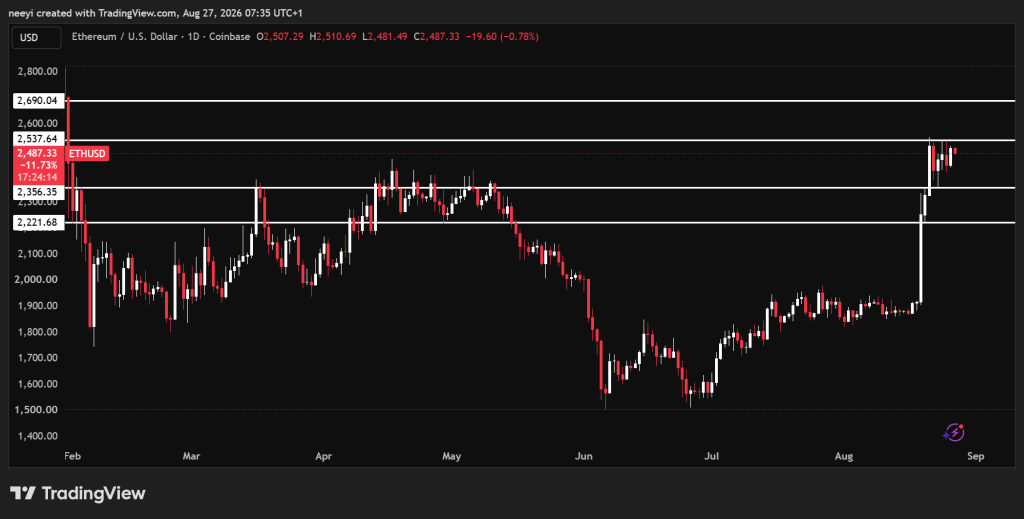
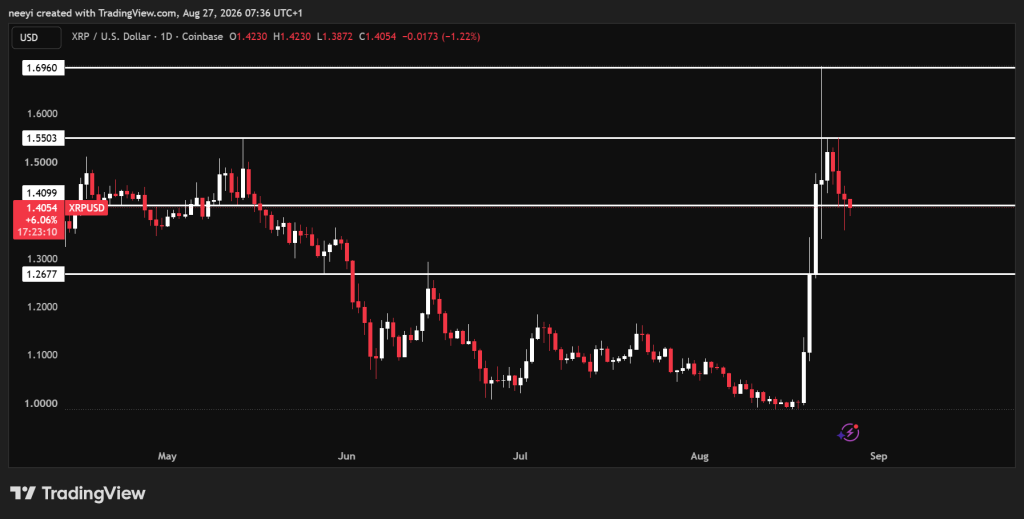
Ethereum price remains trapped between $2,350 and $2,540, XRP price is testing the lower end of its recent range, and Solana price is once again close to the $103 barrier. Each setup offers a clear line between a possible breakout and another move toward lower support.
Technical indicators provide more context. Ethereum and Solana currently have mostly bullish readings, whereas XRP presents a much more divided picture. Here is what the charts and indicators show for each cryptocurrency today.
What you'll learn 👉
Ethereum Price Consolidation Between $2,350 and $2,540 Could Soon End
Ethereum price has continued to consolidate since Saturday, with ETH trading mainly between $2,350 and $2,540. Neither buyers nor sellers have managed to take full control of this range, which leaves Ethereum waiting for a stronger move outside either boundary.
The $2,350 level remains particularly important for the downside. A sustained break below this area could expose Ethereum price to another decline toward $2,200 before the end of August 27.
Buyers have a similarly clear level to overcome. Ethereum needs to break above $2,540 and remain above that area before a larger upward move becomes more likely. Such a breakout could open the path toward $2,700.
The technical indicators currently favor buyers despite the recent consolidation.
The RSI reading of 63.249 places Ethereum above the neutral 50 level but still below the commonly watched overbought zone near 70. That reading shows buyers currently have an advantage without ETH reaching an extreme RSI level.
MACD stands at 57.87 and gives a bullish reading. The positive MACD figure supports the case that upward price pressure remains present, although Ethereum still needs an actual breakout above $2,540 to confirm strength through price action.
The Ultimate Oscillator reads 56.801. A reading above 50 generally favors buyers because it shows positive pressure across the different periods included in the indicator.
Bull/Bear Power comes in at 49.7161 and also favors buyers. A positive reading means bullish pressure currently exceeds bearish pressure under this indicator.
| Indicator | Value | What the Reading Means |
|---|---|---|
| RSI(14) | 63.249 | Buyers have an advantage, but RSI remains below the common overbought level of 70. |
| MACD(12,26) | 57.87 | Positive MACD supports bullish pressure and favors an upside move if resistance breaks. |
| Ultimate Oscillator | 56.801 | The reading above 50 gives buyers an edge across multiple measurement periods. |
| Bull/Bear Power(13) | 49.7161 | Positive Bull/Bear Power shows bullish pressure currently exceeds bearish pressure. |
Ethereum Price Prediction for Today
Bullish scenario: Ethereum price could break above $2,540 and open the door toward $2,700. Buyers would need to maintain the breakout because a brief move above resistance alone may not be enough.
Neutral scenario: ETH could remain between $2,350 and $2,540 throughout the day. Continued movement inside this range would keep the market undecided and leave both breakout levels relevant.
Bearish scenario: Ethereum could lose the $2,350 support level and move toward $2,200. A sustained move below $2,350 would weaken the current setup despite the bullish indicator readings.
XRP Price Is Testing $1.40 as Technical Indicators Give Mixed Readings
XRP price has also spent recent sessions inside a defined range. The cryptocurrency has traded mainly between $1.40 and $1.55, and the lower boundary is now facing pressure.
XRP is attempting to move below $1.40 at the time of writing. A confirmed break that keeps XRP below this area could expose the price to $1.26 before the end of the day.
The upside remains dependent on $1.55. XRP price needs to reclaim and break above that level before buyers have a clearer path toward $1.70.
Technical indicators offer less agreement here than they do for Ethereum. Some readings favor buyers, whereas others show sellers maintaining an advantage.
RSI stands at 49.351, almost directly around the neutral 50 level. This reading gives neither side a convincing advantage and fits the recent consolidation between $1.40 and $1.55.
MACD remains positive at 0.03. The reading technically favors buyers, although its small positive value means XRP still needs stronger price confirmation before an upside breakout becomes convincing.
The Ultimate Oscillator reads 42.72, which falls below the neutral 50 mark. This reading favors sellers and indicates weaker buying pressure across the periods measured by the oscillator.
Bull/Bear Power stands at negative 0.0551. The negative figure gives sellers an advantage and supports the possibility that the $1.40 support could remain under pressure.
| Indicator | Value | What the Reading Means |
|---|---|---|
| RSI(14) | 49.351 | XRP remains almost perfectly neutral, with neither buyers nor sellers holding a clear RSI advantage. |
| MACD(12,26) | 0.03 | MACD remains slightly positive, although the small reading needs stronger price confirmation. |
| Ultimate Oscillator | 42.72 | A reading below 50 favors sellers and points to weaker buying pressure across several periods. |
| Bull/Bear Power(13) | -0.0551 | Negative Bull/Bear Power shows sellers currently have an advantage under this indicator. |
XRP Price Prediction for Today
Bullish scenario: XRP price could recover from the $1.40 area and eventually break above $1.55. A successful breakout could put $1.70 within reach before the end of August 27.
Neutral scenario: XRP could remain trapped between $1.40 and $1.55. The RSI near 50 supports this possibility because neither side currently controls that indicator.
Bearish scenario: XRP could confirm a break below $1.40 and extend the decline toward $1.26. The Ultimate Oscillator and Bull/Bear Power readings make this downside scenario worth watching closely.
Solana Price Needs to Clear $103 to Escape Its Current Trading Range
Solana price has been moving higher from the lower part of its recent range and is now challenging resistance around $102 to $103. SOL currently trades near $101.50, which leaves the cryptocurrency close to an important breakout point.
The broader short term range stretches from roughly $93 to $103. Solana has repeatedly remained inside these boundaries, so $103 represents the main obstacle buyers need to overcome today.
Failure to clear that resistance could keep SOL inside the same range and eventually send the price back toward $93. A break below $93 would weaken the setup further and could expose Solana price to $87.
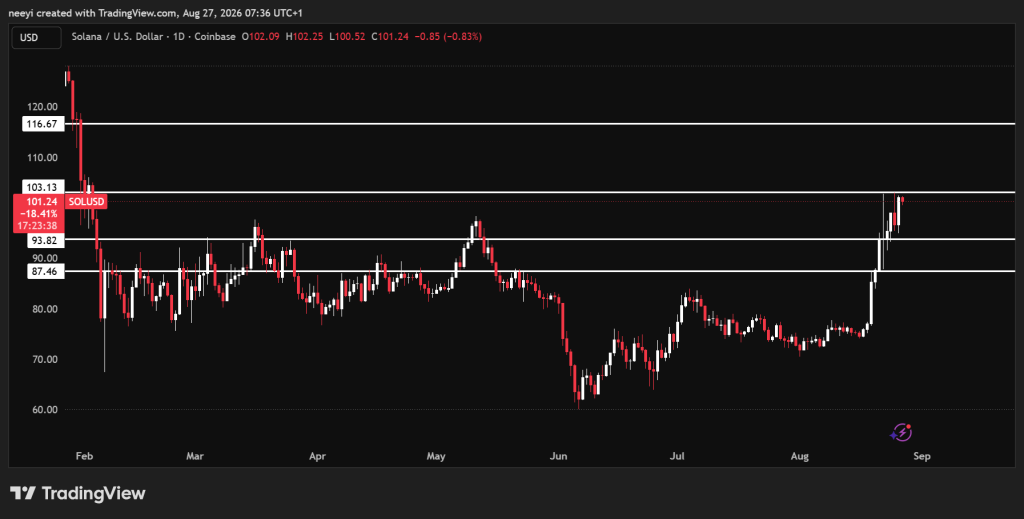
The bullish route begins above $103. A clean break beyond that resistance could allow SOL to target $110 before the end of the day.
Technical indicators currently provide a stronger bullish picture than XRP and are also slightly stronger than Ethereum’s readings.
RSI stands at 66.211, which places Solana comfortably above the neutral 50 mark. Buyers currently control this indicator, although RSI is also getting closer to the commonly watched overbought level of 70.
MACD reads 2.967 and remains positive. This supports the bullish case and shows upward pressure remains present as SOL challenges the upper boundary of its recent range.
The Ultimate Oscillator stands at 59.319. The reading above 50 favors buyers and supports the possibility of another attempt at the $103 resistance.
Bull/Bear Power comes in at 6.948. The positive reading shows bulls currently hold an advantage over bears under this measurement.
| Indicator | Value | What the Reading Means |
|---|---|---|
| RSI(14) | 66.211 | Buyers control the RSI, although the reading is moving closer to the overbought region near 70. |
| MACD(12,26) | 2.967 | Positive MACD supports the current bullish pressure as SOL tests resistance. |
| Ultimate Oscillator | 59.319 | The reading above 50 favors buyers and supports another challenge of the range high. |
| Bull/Bear Power(13) | 6.948 | Positive Bull/Bear Power shows buyers currently have the stronger position. |
Solana Price Prediction for Today
Bullish scenario: Solana price could break above $103 and move toward $110. The bullish indicator readings support this possibility, but price still needs to overcome the resistance itself.
Neutral scenario: SOL could remain between $93 and $103 if buyers fail to clear the upper boundary. Price could continue moving around the upper part of that range without producing a confirmed breakout.
Bearish scenario: Solana could lose its current strength and move back toward $93. A confirmed break below $93 could expose the next downside area around $87.
FAQs
Subscribe to our YouTube channel for daily crypto updates, market insights, and expert analysis.