
Cardano holders have watched ADA slide for days, and a fresh AI forecast now tries to estimate how far the drop could go.
The answer depends on where Bitcoin heads next, and the ADA chart already shows the first levels that buyers need to defend. Here is what the chart, the indicators, and one outspoken analyst are telling us.
What you'll learn 👉
Cardano Price Falls Below Key Support After the Ascending Channel Breaks
Cardano price dropped under a key support level when ADA broke out of its ascending channel toward the end of October. The price has kept moving lower since that break. ADA now trades around $0.189 after losing the $0.19 support zone, and the coin is retesting that old support as new resistance.
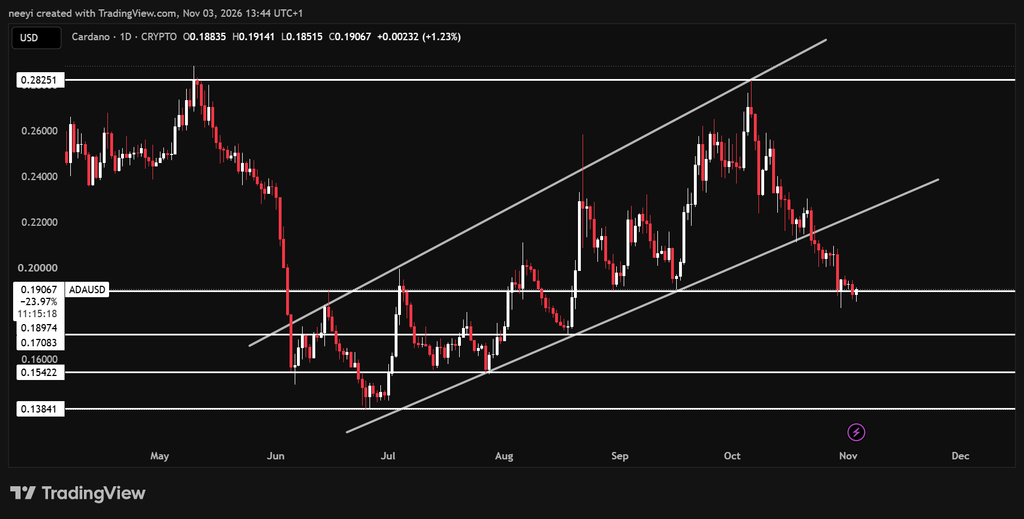
If the retest holds as resistance, ADA could slide toward $0.17 in the coming days. A failure at $0.17 opens the way to $0.154, and a loss of that level puts $0.138 on the table. Buyers still have a path back, though. A reclaim of $0.195 would put the $0.20 area within reach again.
Here are the Cardano levels to watch:
- Support levels: $0.17, $0.154, and $0.138
- Resistance levels: $0.195 first, then $0.20
What the ADA Indicator Readings Say About Selling Pressure
The indicators on the ADA chart lean the same way as the price action. All 5 readings below point to a Sell signal.
| Name | Value | Action |
|---|---|---|
| RSI(14) | 33.394 | Sell |
| STOCH(9,6) | 29.888 | Sell |
| MACD(12,26) | -0.011 | Sell |
| Ultimate Oscillator | 46.790 | Sell |
| Bull/Bear Power(13) | -0.0246 | Sell |
Here is what each reading means in plain terms:
- RSI(14) at 33.394: This is close to the 30 oversold line, so selling pressure is strong, but ADA is not fully oversold yet.
- STOCH(9,6) at 29.888: This is also near oversold territory, which means a short bounce could appear without changing the bigger trend.
- MACD(12,26) at 0.011 below zero: The short-term average trails the longer one, which is a common sign of weak momentum.
- Ultimate Oscillator at 46.790: This is under the 50 midpoint, so buyers and sellers look fairly balanced with a small edge to sellers.
- Bull/Bear Power(13) at 0.0246 below zero: Bears currently control the price, and buyers have not pushed back with enough force.
Together, these readings back up the bearish chart setup. The RSI and Stochastic values do show that ADA is getting closer to levels where short term bounces often begin.
Why Analyst Crypto with Haris Expects Bitcoin To Fall Toward $62K
Cardano rarely moves alone, so Bitcoin analysis matters for ADA holders. Crypto analyst Crypto with Haris (@Crypto__Haris) shared a cautious view on BTC and told traders not to long Bitcoin yet. He agrees the recent drop looks like a good dip, but he says the market is getting hit from several directions at once. He lists a Binance hack, ongoing US and Iran tensions, and pressure across global markets.
Haris expects small Bitcoin pumps to turn out as a bull trap. He also points back to an earlier warning about the $87K rejection, after which BTC dropped below $77K. His expected path looks like this:
- First move down: $82K, then $76K, then $68K, and then $62K
- After the bottom forms: a recovery from $62K to $75K, then $83K, and then $90K or higher
DON’T LONG $BTC YET. Yes, this is a good dip. But the market is getting hit from every direction right now: Binance Hack, ongoing US-Iran tensions, global market pressure. Bitcoin will show some small pumps, but These fake pumps are part of a Bull Trap. I warned you about the $87K rejection, and $BTC dumped below $77K. First move: $82K → $76K → $68K → $62K After the bottom: $62K → $75K → $83K → $90K+ The real bottom is still not in. Don’t rush to buy every dip. My limit orders are already locked in. Now I’m just waiting for the perfect entry. Follow me and turn on notifications. Don’t be late. Whatever update comes next, I’ll post it here first.
— Crypto with Haris ₿ (@Crypto__Haris) November 2, 2026
He believes the real bottom is not in yet and says his limit orders are already placed while he waits for the right entry. His forecast covers Bitcoin only. Still, a BTC move to $62K would likely pull Cardano lower, and the next section explains why.
Cardano Price Prediction From Claude: How ADA Could React if Bitcoin Reaches $62K
Claude AI looked at how ADA behaves around Bitcoin and built several scenarios from that relationship. Everything below comes from that analysis.
How ADA behaves around Bitcoin. ADA is a high beta follower, which means it tends to move more than BTC. One analysis puts the ADA and BTC correlation between 0.65 and 0.85, and ADA usually drops harder when Bitcoin falls. A reasonable working assumption is that ADA moves 1.2x to 2x as much as BTC on the way down, and even more during liquidation cascades.
Read Also: Bitcoin, Ethereum and XRP Sentiment Is Collapsing, But There’s a Catch
A recent example. Bitcoin dipped below $62,000 around the early June flush, and roughly $3B in liquidations hit the market. ADA fell below $0.20 that week and lost over 30%. It then made a low of $0.1384 later that month. That episode is the closest template for what a Bitcoin move to $62K could look like.
Cardano specific weakness. Founder Charles Hoskinson flagged community reluctance to fund struggling ecosystem projects. He cited the TapTools shutdown and the cancelled Cardano 2026 Summit. Those problems limit how far ADA can separate from Bitcoin to the upside.
Where Bitcoin trades now. BTC fell about 2.2% to around $76,450, which extends its 7 day decline to 3.6%. Spot ETFs recorded $398.6M in outflows on November 2. Key support is $76,000 and resistance is $78,500. October jobs data arrives on November 6, and the Fear & Greed Index reads 34, which falls in the Fear zone. A move to $62,000 would mean a 19% drop from here and would revisit the June flush level.
Claude applied beta multiples to the current ADA price of about $0.187. The probability weights are Claude’s own judgment and not a model output.
| Scenario | ADA Beta vs BTC | ADA at BTC $62K | Weight |
|---|---|---|---|
| A. Relative strength, with dip buyers defending $0.138 | 0.8x to 1.0x | $0.155 to $0.165 | 20% |
| B. Standard beta, with an orderly grind lower | 1.2x to 1.5x | $0.133 to $0.144 | 45% |
| C. Capitulation, with a liquidation cascade | 1.8x to 2.2x | $0.105 to $0.125 | 25% |
| D. Cardano specific breakdown while BTC stabilizes | Not applicable | $0.12 to $0.14 | 10% |
Each scenario carries its own conditions:
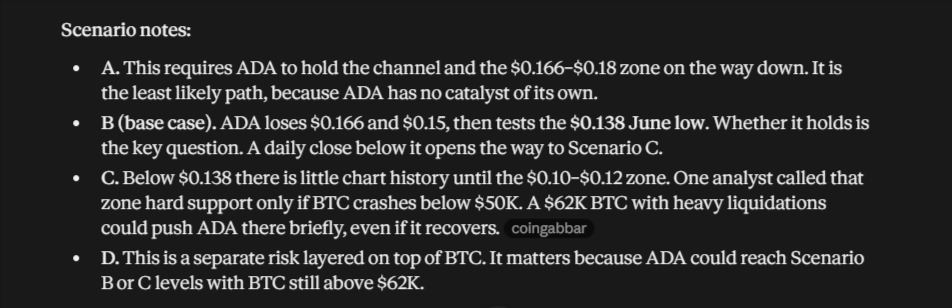
- Scenario A: ADA needs to hold the channel and the $0.166 to $0.18 zone on the way down. This is the least likely path because ADA has no catalyst of its own.
- Scenario B: ADA loses $0.166 and $0.15, and then tests the $0.138 June low. Whether that low holds is the key question, and a daily close below it opens the way to Scenario C.
- Scenario C: Chart history is thin below $0.138 until the $0.10 to $0.12 zone. One analyst called that zone hard support only if BTC crashes below $50K. A $62K Bitcoin with heavy liquidations could push ADA there briefly, even if it recovers.
- Scenario D: This is a separate risk layered on top of Bitcoin. ADA could reach Scenario B or C levels while BTC still trades above $62K.
Which Cardano Price Prediction Looks Most Realistic
Scenario B looks like the most realistic path. It carries the highest weight at 45%, and its range of $0.133 to $0.144 lines up with the chart levels discussed earlier. The $0.17 and $0.154 supports are the natural stops on the way down, and the $0.1384 June low falls inside that range. The Sell readings on all 5 indicators also match an orderly grind lower rather than a sudden crash.
Read Also: XRP Network Growth Explodes After the Binance Hack!
Scenario C deserves attention too, since it carries a 25% weight. It would need a heavy liquidation event, and the June flush showed that such events can happen. Scenario A looks least likely because ADA has no strong catalyst of its own right now.
Two levels will probably decide the direction. A daily close below $0.138 would make the deeper scenarios far more relevant. A reclaim of $0.195 would weaken the bearish case and bring $0.20 back into focus. Bitcoin’s reaction around $76,000 and the jobs data on November 6 could also set the tone for the next few days.
Subscribe to our YouTube channel for daily crypto updates, market insights, and expert analysis.