Cardano (ADA) price action lately has been worth taking a look at with the token dropping below the $1 mark. Despite months of growth, the crypto is under increased selling pressure. On-chain statistics and important technical indicators provide information on ADA’s present situation and possible future directions.
What you'll learn 👉
Cardano Price Action Signals a Bearish Shift
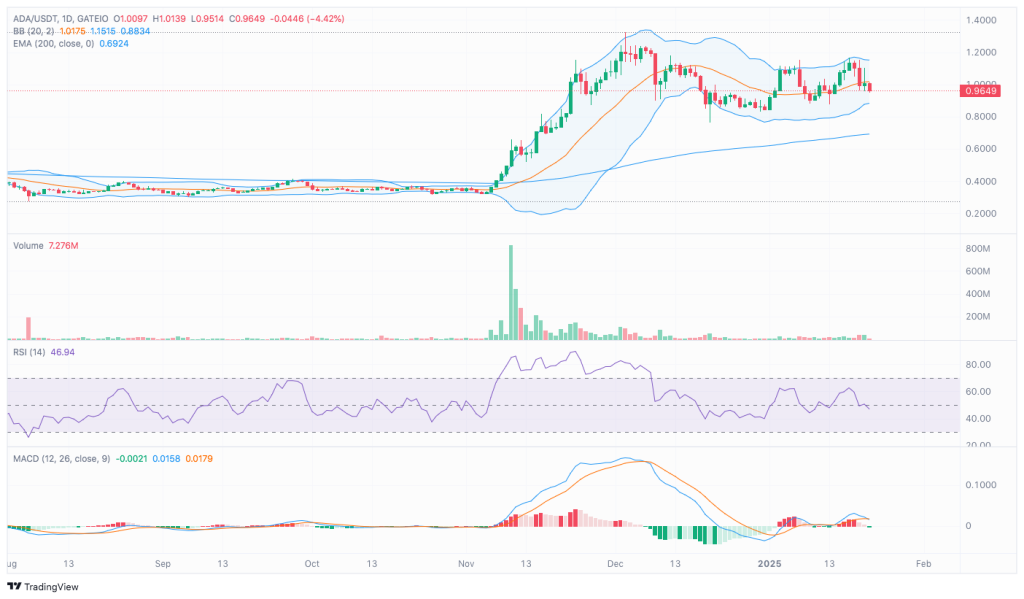
ADA is trading around $0.96449 after falling 4.42% in a day. The price surged through November and December before entering a consolidation phase near $1.20. However, a decline below the $1 threshold indicates renewed bearish momentum.
Support levels remain in the $0.90-$0.95 range, aligning with the lower Bollinger Band. ADA must reclaim $1.00 as immediate resistance before targeting $1.20, a level tested multiple times in December. With traders assessing whether this drop portends a short-term correction or a longer slump, market mood is still split.

ADA’s Technical Indicators Suggest a Potential Reversal
The 200-day EMA, currently at $0.6924, remains upward trending, supporting a broader bullish outlook. However, short-term indicators show weakness, with ADA approaching the lower Bollinger Band at $0.8834, hinting at oversold conditions.
The RSI readings stand at 46.94, indicating neutral-to-slightly bearish momentum. If the RSI falls below 40, it could confirm stronger selling pressure. The MACD indicator also suggests a fading bullish divergence, with the MACD line barely holding above the signal line at 0.0021 versus 0.0158. A bearish crossover could trigger further declines.
On-Chain Data Shows Steady Adoption
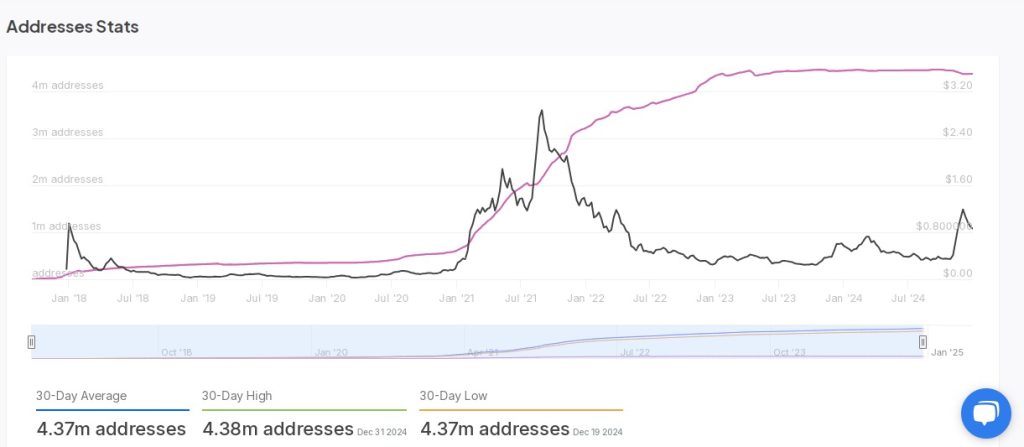
Despite the price decline, on-chain data from IntoTheBlock highlights stable network activity. ADA’s total address count remains around 4.37 million, showing resilience even during market downturns. The consistent rise in addresses since 2021 reflects long-term adoption.
According to historical statistics, network expansion has stayed consistent even though ADA saw substantial price reductions after 2021. This, according to analysts, shows that despite short-term price volatility, Cardano’s fundamentals are still reliable.

Read also: Why Is Raydium (RAY) Price Pumping? These On-Chain Metrics Explode
What’s Next for ADA in 2025?
With ADA trading near key support levels, analysts suggest that breaking above $1.00 could signal renewed bullish momentum. However, failure to hold above $0.90 might trigger further losses.
Investors are watching volume trends closely, as declining volumes indicate indecision among traders. If buying interest picks up, ADA could reclaim its bullish trajectory. Conversely, prolonged weakness could lead to a retest of lower support zones around $0.80 or lower.
Follow us on X (Twitter), CoinMarketCap and Binance Square for more daily crypto updates.
Get all our future calls by joining our FREE Telegram group.
We recommend eToro
Wide range of assets: cryptocurrencies alongside other investment products such as stocks and ETFs.
Copy trading: allows users to copy the trades of leading traders, for free.
User-friendly: eToro’s web-based platform and mobile app are user-friendly and easy to navigate.


