Bitcoin recently confirmed that it’s not yet ready for a stronger breakout. A strong drop from the near $7400 levels to just above $6200 has been followed up by a slight bounce as of late, as Bitcoin managed to close the daily above $6500. The feeling regarding where we are going next is divided at the moment as the market seems to be stuck in a long-term $5800/$8000 range. We decided to once again check out what some experienced traders had to say about the current market situation:
Bitcoin (BTC)
CryptoMedication noticed a rounding bottom formation on the chart, thanks to a “Fib Wheel” tool provided by TradingView:
“What you see on the chart above is something called the ‘Fib wheel’. The Fib Wheel (courtesy of TradingView), was applied on this chart to get a better idea of where we should start the rounding bottom chart formation.
Why?
Because of the design of the Fib Wheel itself. It virtually plots out various rounding bottom formation lengths (based on fib levels). These different lengths are designed for products of varying volatility and price fluctuation.”
He provides a deeper insight with several “facts” that he feels are likely to happen:
- Fact #1: The ‘lip’ of the cup is at $10k.
- Fact #2: The potential bottom is at $3k
- Fact #3: The cup predicts that the lip may be surpassed at any point between April 11th 2019 and June 19th, 2019
- Fact #4: The rounding bottom formation (as applied in this case), predicts that the ATHmay be broken at any point between June 20th, 2019 and August 17th, 2019
An in-depth look into the tool, pattern and why he feels this scenario might unfold can be seen here. Trader FlaviusTodorius67 thinks there is potential for a short-term upside for BTC:
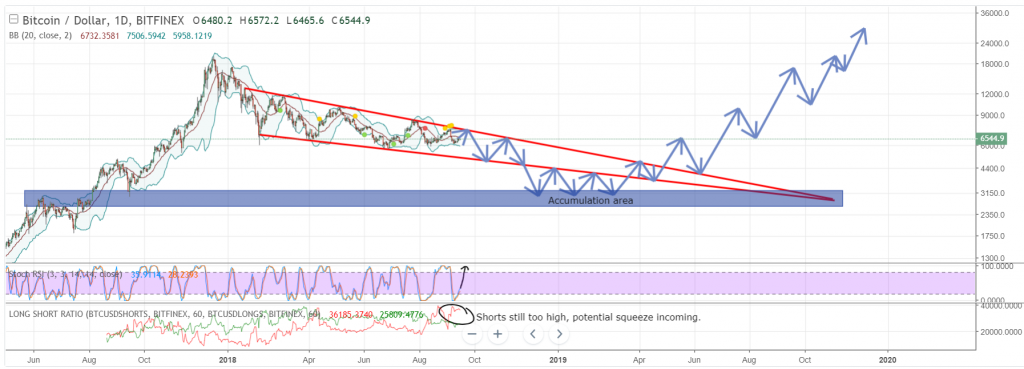
“The shorts are still very high; I think a short squeeze is almost inevitable. So, we could go up to around 7500 again, before resuming the bearish downtrend.
The low, and this is also suggested by other analyses, is probably in the 3000 area. It goes back to the china crash in 2017, where 3k served as an excellent support.
Then we’ll probably see a bottom formation and bouncing around that area. Then sometime in 2019 we’ll get ready for the next bullrun towards new ATHs.”
His analysis provides a deeper insight into why he feels like a bullrun isn’t yet happening so check that out as well. Finally, we looked at CrypToSpac3mAn who noticed a set of lower highs forming on the BTC chart:
“Every rally so far has been stopped out by the .62 retracement. Following this logic our next move up should take us to under $6900. If we break over this level and show consolidation I would consider going long. The only Bullish thing to consider here is the decrease in each move down and the set of Higher Lows that have currently been put in.”
Check out his complete analysis here.
Ethereum (ETH)
While Ethereum managed to rally decently in the last couple of days and give traders a chance to place some short-term longs, YoungShkreli noticed that it was the perfect currency to short in the last couple of months:
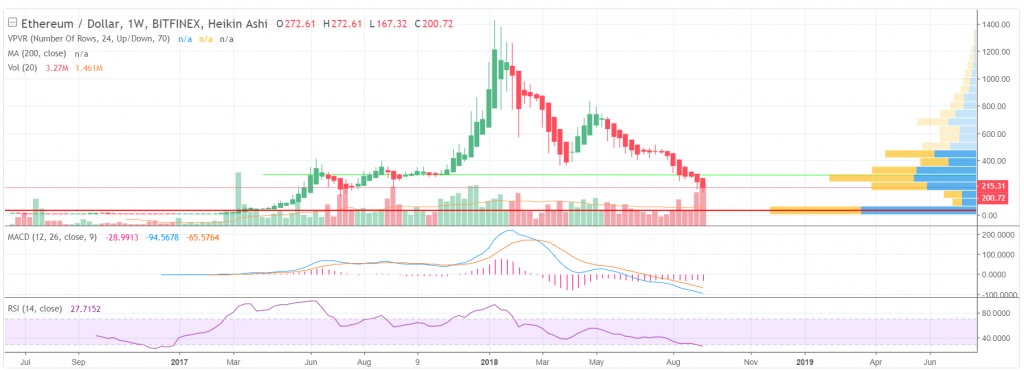
“Look at this chart. Every single week registered gave you another week to profit off of. This could have made anyone all kinds of money had they been trading it. Yours truly wishes he had shorted ETH instead of bitcoin 0.90% recently for sure. Perfect chart.”
The full analysis goes into detail on what he feels would be a good point to start buying Ethereum. An extensive post from benice_trader explains that Ethereum is not a good idea to invest in right now:
“It is likely that the cost of an Ethereum token will decrease faster than Bitcoin. It will be like this until the mentioned levels reach the targets of token decrease, and simultaneously reach the dominance index of 62, 65 and 68 values, and the cost of Bitcoin of 5800, 5300 and 4800, respectively. It is ahead of the game to enter the coin before these values are achieved. At least, until the token gives an explicit signal for a reversal. In the current situation, it is better to wait out the market decline in Bitcoin, Stable Coin, or, if you are very conservative, in Fiat.”
Their overview offers an extensive insight into what brought Ethereum to where it’s currently at and some precise targets for the future; check all of that here.
Ripple (XRP)
Trader easyMarkets provided the XRP analysis:
“XRPUSD is approaching our first resistance at 0.2901 (horizontal swing high resistance, 100% Fibonacci extension, 38.2% Fibonacci retracement , descending resistance line) and a strong drop might occur below this level pushing price down to our major support at 2.2687 (horizontal overlap support, 61.8% Fibonacci retracement, 61.8% Fibonacci extension). Stochastic (89,5,3) is also approaching resistance and a reaction below this level might see a corresponding drop in price.”
Check out the graph here.
Other thoughts
Overall the market seems to be enjoying the slight period of calm that Bitcoin went in the recent couple of days. Bitcoin Dark, Loopring and Lisk were the biggest losers today, with 5%, 3.5% and 2.5% losses respectively. Meanwhile Tezos (24%), MOAC (20%), Populous (16%) Huobi Token (10%) and Maker (10%) led the risers with double digit gains in the last 24 hours. Overall, alts seem to be very close to bottoming out:
https://twitter.com/TheCryptoDog/status/1039325103681486848
If only we could say the same about Bitcoin.