
Bitcoin currently is in a well-defined corrective mode, with the BTC prices responding sharply to previous breakdowns observed on the 4-hour chart. The BTC price has lost its upward momentum after being unable to stay above the $70,000 level, with sellers remaining in control beneath moving averages.
However, there is no single trend in this current scenario. There are signs that selling momentum is starting to slow down in some areas, even though the broader structure is still weak.
What you'll learn 👉
BTC Price Structure Shows Sellers in Control
We took a look at the 4H chart, and we can see that the structure appears to be biased towards a bearish direction. BTC has been making lower highs and lower lows from the May highs where BTC was trading at $73,000-$75,000. This signals a breakout in terms of structure.
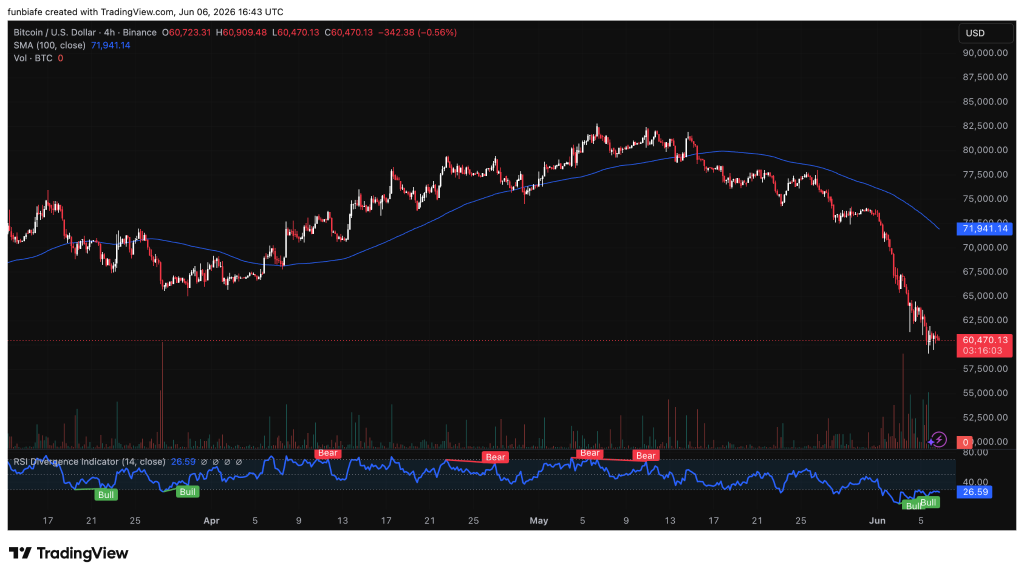
The 100-period moving average is at $71,941, and this acts as a good resistance point. Whenever BTC approached this point, it was always rejected. This indicates that the buying pressure does not seem to be enough at the moment for them to regain their trend momentum.
Right now, we have BTC trading at the range of $60,000-$60,500.
Momentum Is Weak but Oversold Conditions Are Building
The RSI reading on the 4H timeframe sits at 26.59, which places Bitcoin in deeply oversold territory. That level often shows up after aggressive sell pressure. Even though RSI is low, it does not confirm a reversal on its own. It only tells us that selling momentum is stretched. A number of short-term “bullish” indicators have emerged; however, they have yet to be potent enough to influence structure.
The volume associated with the recent red candles has been relatively greater than the previous trading session volume, suggesting that the sellers were more convinced about their sell-off at the time of breakdown. Nonetheless, the recent candles display weakening momentum.
Right now, the most important zone is $60,000–$60,500. This area is acting as immediate support for the BTC price. If Bitcoin holds this level, the first upside reaction traders are watching sits between $65,000 and $67,000. That would represent a relief bounce rather than a full trend reversal.
Above that, $71,941 remains the major resistance level because it matches the 100 SMA. Until Bitcoin breaks above that, the broader bearish structure stays intact. If $60,000 fails to hold, the next area of interest is $58,000–$59,000, which would mark a deeper correction phase.
| Name Of Indicator | Metrics | Interpretation Of Metrics |
| RSI (14) | 26.59 | Strong Buy |
| STOCH (9,6) | 18.45 | Strong Buy |
| MACD (12,26) | -1,234 | Sell |
| Ultimate Oscillator | 32.18 | Buy |
Read Also: Bitcoin and Stocks Crash Together – $2.5 Trillion Wiped as Fed Flips Hawkish
Bitcoin Price Prediction Scenarios for June 7
Bearish Scenario – The Bearish Case is valid as long as the BTC price remains below $71,941. In this situation, the price may keep declining or consolidating in a range of $60,000 to $58,000 because of low demand and rejections of the resistance level.
Neutral Scenario – The consolidation scenario takes place in the event that the price remains above $60,000, without breaking higher levels. At such a time, the market will consolidate between $60,000 to $65,000, waiting for a more powerful catalyst, especially after a significant price decline as volatility begins to subside.
Bullish Scenario – The bullish scenario is contingent on the fact that the price manages to hold above $60,000 and subsequently recovers to $65,000 – $67,000. With this, the price can begin rallying towards its previous resistance level, now acting as support at the 100 SMA of $71,941.
Macro and Market Conditions Still Matter
Beyond the chart, there are some developments that influence Bitcoin. First, the ETF inflows are mixed: although there are more than 1.51 million BTC held in spot ETFs, redemptions worth $326 million on June 5 indicate that institutional investors are still wary of further investment.
Another important element is the tight macroeconomic environment caused by restrictive policies, which dampen risk appetite. However, there is whale accumulation that amounts to more than 61,000 BTC.
Overall, all these elements indicate why Bitcoin lacks directional bias at the moment. It has a weak short-term technical structure, but not one of breakdown yet. The BTC price is responding to an important support region, and its actions around the $60,000 price will determine whether there will be a new bullish rally or another leg down.
Sustaining above this support brings a relief rally towards the $65,000-$67,000 range. Breaking below it leads to a bearish scenario targeting lower levels such as $58,000. For now, Bitcoin is in a decision zone, and the next move will depend entirely on whether buyers step in at current support or step aside.
FAQs
Subscribe to our YouTube channel for daily crypto updates, market insights, and expert analysis.