Bitcoin is entering Monday in a pretty awkward spot. BTC is trading near $64,090, about 0.31% lower on the latest 4-hour candle, and the market still has not chosen a clear direction. After several days of chopping around between support and resistance, traders are watching the next move closely because Bitcoin is right on top of a major technical level.
What makes this setup interesting is that the market is getting mixed signals from almost every angle. Spot Bitcoin ETF inflows remain strong, institutional demand has not disappeared, and some analysts believe the weekly chart looks a lot like the 2022 bottom. At the same time, short-term momentum has cooled, and Strategy has been selling Bitcoin this year instead of adding to its holdings.
What you'll learn 👉
BTC Price Action – Structure by Phase
When we zoom in on the Bitcoin chart, the recent price action becomes much easier to follow. BTC rallied strongly in mid-July and pushed into the $66,300-$66,400 area, which marked the top of the visible range. Buyers could not hold that breakout attempt, and the market rejected the move with several heavy red candles.
What followed was a messy topping phase between $65,000 and $66,300, in which BTC attempted a number of pushes higher but in vain. Rejections of this type indicate the distribution of positions before a major bearish move.
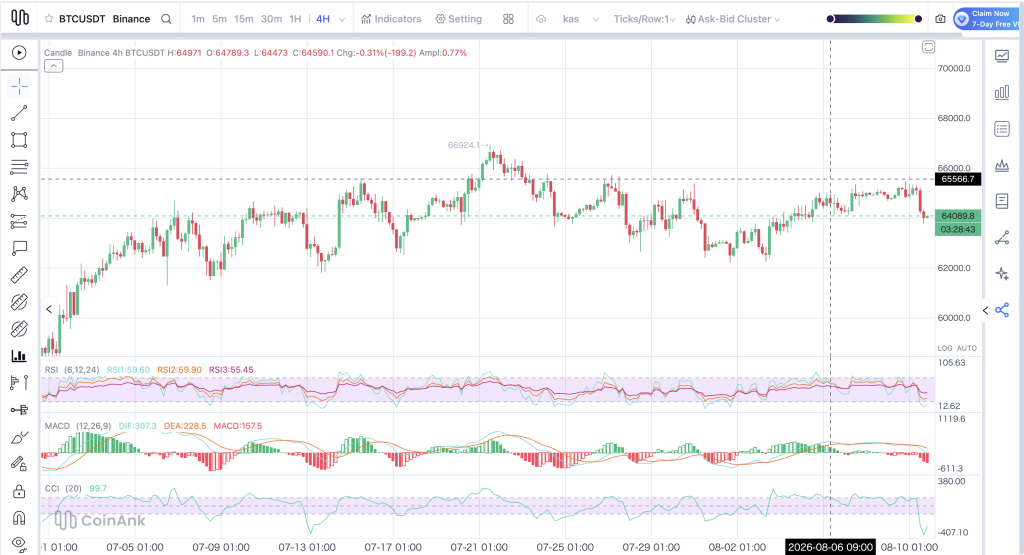
First, the Bitcoin price was pushed under $65,000 and to the level of $64,300. An upward correction to the mark of $65,700 did not hold long, and BTC began to plummet sharply. In just a few candles, the BTC/USD pair fell from $65,600 to around $63,700.
Subsequently, the Bitcoin price was in the process of consolidation around $63,600 – $64,400 for some time. Another attempt to recover ended up at $64,900. That set up the major washout on August 1, when the Bitcoin price broke down decisively and tagged the swing low at $62,235.20, the lowest level of the entire move.
It was at that point that the market saw a strong bounce. Bitcoin recovered back towards $65,000 before retracing slightly and recovering more cautiously. This recovery looked stronger in nature as it generated higher lows compared to previous V-shaped bounces.
Current leg: Bitcoin has since broken above $65,000, made a local high of $65,500, and has consolidated into a tight range between $65,100 and $65,300. The market is effectively pressing against the upper boundary of its recent range.
Support & Resistance Zones:
| Level | Type | Notes |
| $66,300-$66,400 | Major resistance | Origin of the chart’s high; untested since rejection |
| $65,500-$65,700 | Resistance | Rejected multiple times |
| $65,000 | Pivot / psychological | Flipping between support and resistance |
| $64,000-$64,300 | Support | Held as a floor several times |
| $63,000-$63,700 | Support | Retest zone after the flush; now a demand area |
| $62,235.20 | Major support | Swing low and capitulation wick |
The level that matters most right now is the $65,000-$65,500 pivot zone. Bitcoin is trading directly against that area, so the next move from here is likely to be important.
Indicators:
RSI (6, 12, 24): The fast RSI has gone up to 79.31 and is clearly overbought. The medium one stands at 67.65, while the slow RSI is about 61.11. To put it simply, the short-term momentum has surged much faster compared to the overall momentum, which is typical for local peaks.
MACD (12, 26, 9): The MACD continues to be positive as DIF and DEA stand at 98.17 and 84.98 respectively, and the histogram shows positive readings.
CCI (20): The CCI index stands at 168.23, which is a clear overbought situation as the indicator has exceeded the level of +100.
In summary, Bitcoin fell to around $62,235 from the $66,400 level in about ten days and bounced back in multiple moves to retest the $65,000-$65,500 resistance area. The overall recovery setup remains intact, but the short-term technical picture has become overbought.
The two plausible scenarios for the coming days are the following. First, there could be some consolidation towards $64,000 as buyers consolidate the gains and the RSI and CCI have enough time to correct before another upleg. Second, the bulls may succeed to break through the $65,500-$66,300 resistance range.
For me, the main level is $65,000. It should be held on the upside to keep the uptrend intact and to preserve the recovery pattern. If it fails, then the $63,000-$64,000 support range will be retested.
Bitcoin News: Strategy Has Been Selling BTC
One of the biggest talking points this weekend has been Strategy’s treasury activity. Data shared by Bull Theory showed that Strategy sold 1,690 BTC for about $108.6 million and used the proceeds to repurchase STRC preferred stock. The company has sold roughly $432 million worth of Bitcoin in 2026 so far and has not bought BTC for seven straight weeks.
BREAKING: Strategy sold 1,690 Bitcoin for $108.6 million.
— Bull Theory (@BullTheoryio) August 10, 2026
Company used the proceeds to repurchase $108.6M of its STRC preferred stock.
Strategy has now sold $432 million worth of Bitcoin in 2026 so far.
Strategy hasn’t bought BTC for 7 consecutive weeks, instead focusing on… pic.twitter.com/unldvhzSdk
That sounds dramatic, but Strategy still owns 840,447 BTC, which keeps it by far the largest corporate Bitcoin holder in the world. The market reaction has been relatively calm, though the sales do remove one source of steady buying that many investors had become used to seeing.
Why Some Analysts Are Still Bullish
Despite the near-term weakness, the longer-term bullish case has not disappeared. Bitcoin Archive shared a chart from Bull Theory pointing out that the current weekly structure looks surprisingly similar to the setup that formed in late 2022.
Everything is lined up perfectly for Bitcoin on the weekly chart for a strong move up.
— Bitcoin Archive (@BitcoinArchive) August 10, 2026
It looks just like the 2022 bottom.
We are ready. 😎 pic.twitter.com/FlNsa2CUNu
Back then, Bitcoin built a base near the cycle low, momentum indicators started printing higher lows, and a much larger recovery followed over the next two years. The current weekly chart shows BTC holding above the $60,000-$65,000 region, which many analysts view as the key macro support zone.
Momentum indicators on the weekly timeframe are behaving in a similar way to how they behaved before Bitcoin began recovering from the 2022 bear market. The basic argument is that if Bitcoin can continue defending the $60,000 floor and eventually break above resistance, this consolidation phase could become the foundation for a much larger move in 2027.
Read Also: AI Models Are Split on Bitcoin’s Next Move – Here Are the Details
Bitcoin Price Forecast for Today (August 11)
Bitcoin is currently trading at $65,100-$65,300, which indicates that the price remains firmly inside the most critical pivot area on the chart. Short-term technicals are overextended, but the larger pattern of recovery is intact for now.
Bullish Case: In case of continuation of buying pressure above $65,000 and breach of $65,500 level accompanied by increased volume, then the next level to consider would be $66,300-$66,400, the same pivot that has been rejecting BTC since July. A clean move through that resistance could bring $67,000-$68,000 into play pretty quickly. A breakout above $66,400 would be a meaningful structural improvement and could put $70,000 back on the table.
Neutral Scenario: The outcome that looks most likely to me is more sideways trading between $64,000 and $65,500. The RSI and CCI are both in overbought territory, so the market may need a breather before attempting another leg higher.
Bearish Scenario:In the event that the price falls below $65,000, the initial support zone will be at $64,000-$64,300. A breakdown of $64,000 can see Bitcoin heading to the $63,000-$63,700 demand zone, where it previously found its footing following the capitulation witnessed on August 1.
My Take: The one thing I keep revisiting is the $65,000 level, considering that it represents the actual level of importance at this time. Bitcoin has come a long way since it made the lowest point seen on August 1; however, technical indicators have become quite extended, meaning a correction to $64,000 is actually bullish.
A bullish setup requires Bitcoin to remain above the $65,000 level and break above $65,500, while a bearish scenario would see the price losing $65,000 and retracing back towards the $63,000-$64,000 region. For now, I will be eyeing the $65,000 level closely. If buyers manage to defend the $65,000 level, the recovery pattern remains intact. If not, the short-term picture turns neutral or bearish.
FAQs
Subscribe to our YouTube channel for daily crypto updates, market insights, and expert analysis.