
Bitcoin price has recovered from its recent lows of around $58,000, although one question continues to dominate market discussions. Can BTC really climb to $150,000 within this year, or has that target become far too optimistic?
Bitcoin reached a record high of around $126,000 in October 2025 before the market entered a deep correction. Several months later, BTC price remains well below that peak, and historical market cycles suggest recoveries to fresh all time highs often take much longer than many expect.
That cautious outlook also appears in prediction markets. Polymarket currently assigns only a 3% chance that Bitcoin reaches $150,000 in 2026. Those odds paint a very different picture from many of the bold price targets circulating across social media.
What you'll learn 👉
Bitcoin Price Continues Trading Between Major Support and Resistance
Bitcoin is currently trading around $65,000 inside a crucial consolidation range. Recent price action shows buyers continue defending important support levels, although sellers remain active near overhead resistance.
Several technical factors have helped stabilize BTC price over the past few weeks. Institutional demand through spot Bitcoin ETFs has continued to provide support, and softer U.S. inflation data has improved overall market sentiment.
Several important price levels deserve close attention.
Key resistance levels include:
- $66,400 to $67,000 remains the first barrier. A daily close above this zone would improve Bitcoin’s short term structure.
- $70,000 to $72,200 marks another major resistance area. This zone also aligns with the average cost basis for many short term holders and could trigger liquidations if BTC breaks higher.
- $82,750 remains the next major swing high. A move above this level could reopen the path toward the $100,000 region.
Support remains equally important.
- $64,000 serves as immediate support.
- $60,000 to $61,000 has acted as a triple bottom several times this year.
- $58,300 represents the most recent swing low.
- $53,000 remains the final major support area because it closely matches Bitcoin’s realized price.
Bitcoin’s Weekly Descending Channel Offers A Different Perspective
Optimistic price targets often overlook one technical pattern that has guided Bitcoin price since its all time high.
A look at the weekly chart shows BTC has traded inside a descending channel ever since the October 2025 peak near $126,000. Each recovery attempt has stalled close to the upper boundary before another decline followed. That same resistance currently sits close to $67,000.
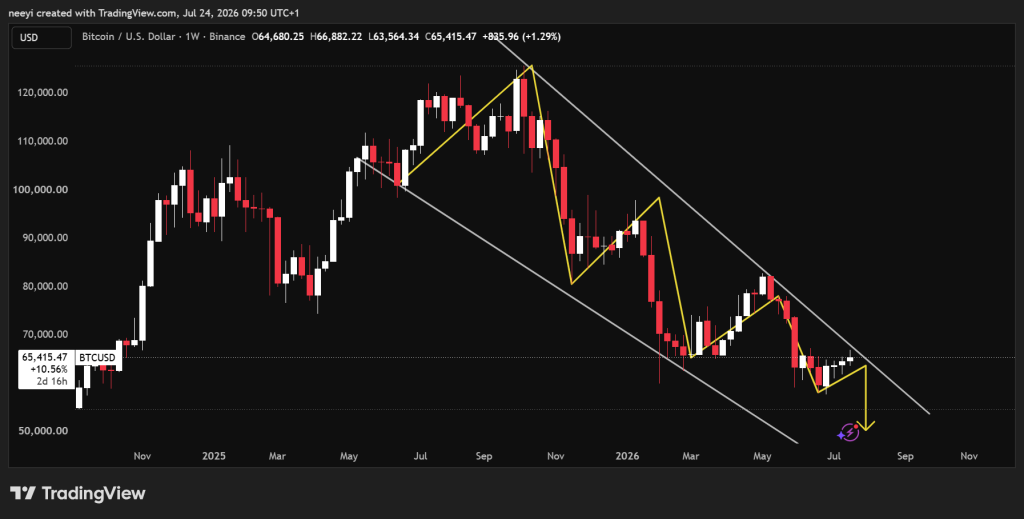
Another rejection from that level could send Bitcoin back toward the lower boundary of the channel. That support continues to rise gradually, although it still leaves room for a decline toward the $53,000 area if sellers regain control.
This pattern does not guarantee another selloff. It simply shows the broader correction remains intact until Bitcoin produces a convincing breakout above channel resistance.
Weekly Technical Indicators Continue Sending Mixed Signals
Weekly indicators from Investing.com also present a mixed outlook instead of pointing toward a clear breakout.
The Relative Strength Index currently stands at 40.357, which still carries a sell signal. That reading shows bullish strength has improved compared with previous lows, although momentum has not fully recovered.
The Stochastic Oscillator has moved to 75.388 and now produces a buy signal. This indicator often measures shorter term momentum and suggests buyers have regained some control during the recent rebound.
The MACD remains negative at -6,814.3. That continues to generate a sell signal because the broader trend still points downward despite recent gains.
The Ultimate Oscillator stands at 55.276 and currently supports a buy signal. This indicator combines several timeframes and points to improving buying pressure.
| Indicator | Value | Signal |
|---|---|---|
| RSI (14) | 40.357 | Sell |
| Stochastic (9,6) | 75.388 | Buy |
| MACD (12,26) | -6,814.3 | Sell |
| Ultimate Oscillator | 55.276 | Buy |
Taken together, these indicators show Bitcoin has improved in recent weeks, although the broader trend has not fully turned bullish.
ETF Flows And On Chain Data Show Conflicting Signals
Fresh ETF data shared by Crypto Patel revealed U.S. spot Bitcoin ETFs recorded net outflows of 3,481 BTC, worth about $225.18 million, yesterday.
BlackRock accounted for most of that activity after selling 3,130 BTC, worth about $202.48 million. Fidelity, Bitwise, Franklin, ARK 21Shares, and WisdomTree also recorded Bitcoin outflows. Morgan Stanley stood out as one of the few buyers after adding about 77 BTC.
Crypto Patel noted that Bitcoin ETFs sold almost 8 days worth of newly mined Bitcoin supply during that single session.
ETF FLOWS: US SPOT CRYPTO ETFs FLOWS DATA UPDATE (23-07-2026) YESTERDAY
— Crypto Patel (@CryptoPatel) July 24, 2026
🟥 Bitcoin ETFs: -3,481 $BTC (-$225.18M)
🟩 Ethereum ETFs: +14,030 $ETH (+$26.32M)
🟥 HYPE ETFs: -17.61K $HYPE (-$1.02M)
🟩 CHAINLINK ETFs: +18.22K $LINK (+$153.91K)
🟩 $XRP, $SOL, $BNB, $AVAX, $DOT, $HBAR,… https://t.co/djmhAO1Hxx pic.twitter.com/ndOFed7WuM
Ethereum presented a different picture. Spot Ethereum ETFs added 14,030 ETH, worth approximately $26.32 million, which shows institutional demand remained stronger for ETH during the same period.
Exchange Reserves Continue Falling Despite Recent ETF Selling
Another update shared by Crypto Patel presents a more constructive picture over the longer term.
Binance’s Bitcoin reserves have fallen to roughly 650,000 BTC, and exchange netflows remain negative. Coins continue leaving exchange wallets and moving into cold storage, which often indicates investors prefer holding their Bitcoin instead of preparing to sell.
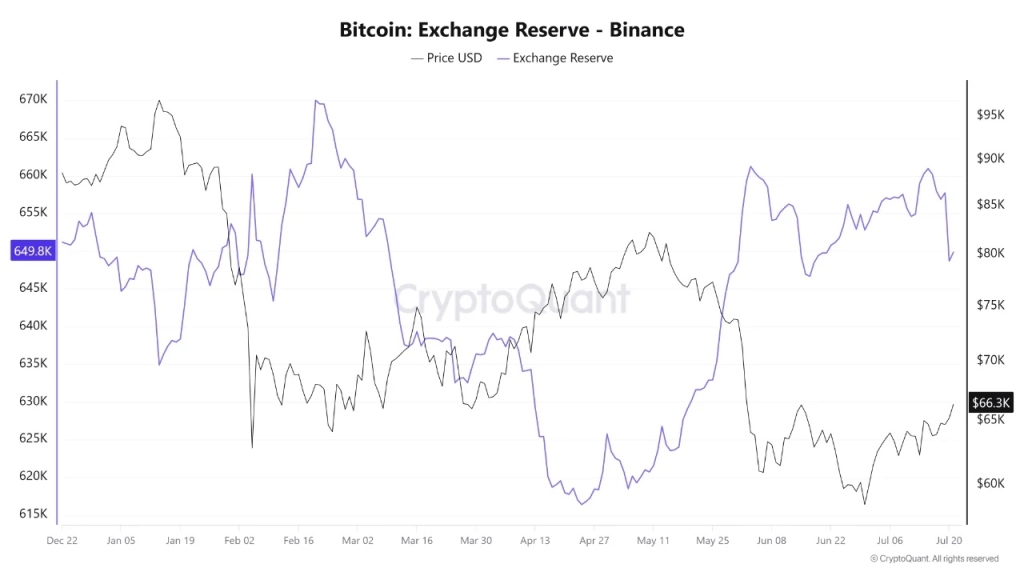
Crypto Patel also pointed out that long term holder supply continues expanding, exchange reserves keep falling, and ETF demand has absorbed a large portion of available supply over recent months.
Those conditions gradually reduce the amount of Bitcoin available for immediate sale. Supply becomes tighter if demand returns, although price still depends on broader market conditions.
CoinAnk Data Shows Buyers And Sellers Remain Closely Matched
CoinAnk data also helps explain why Bitcoin price has struggled to produce a decisive move.
The net inflow chart shows exchange inflows and outflows have remained relatively balanced during recent days after much larger swings earlier this year. That usually indicates neither buyers nor sellers currently hold a clear advantage.
The long versus short chart presents a similar picture.
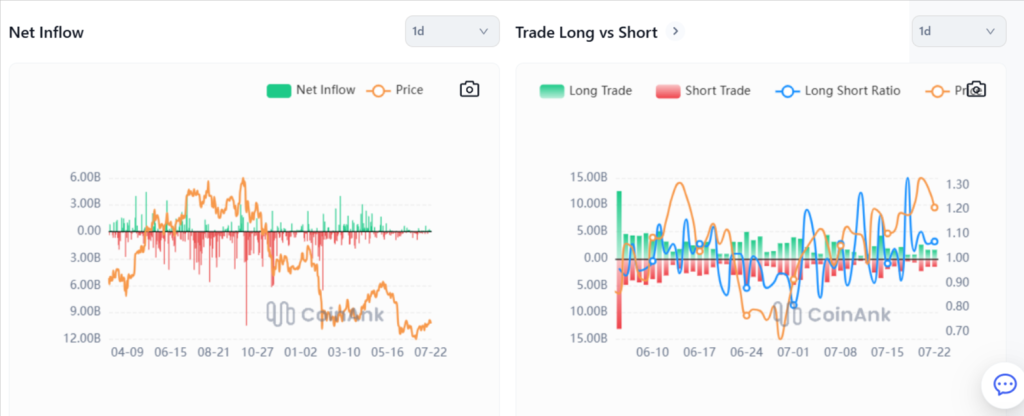
Long positions have increased slightly during recent sessions, and the long to short ratio has moved above 1.0. That means bullish positions currently outnumber bearish positions by a small margin.
Price, however, has not followed with a strong breakout. That tells us traders remain cautious despite improving sentiment, especially after Bitcoin failed to reclaim higher resistance levels.
Bitcoin Price Prediction Points to Two Possible Outcomes
Bitcoin Could Rally Toward $82,750
Bitcoin needs to break above the $67,000 resistance level to strengthen the bullish outlook. A successful move could send BTC toward the $70,000 to $72,200 zone first. Buyers may then target the $82,750 swing high if momentum continues to improve.
Bitcoin Could Still Drop to $53,000
Failure to break above $67,000 would keep the weekly descending channel intact. Bitcoin could revisit support around $64,000 before testing the $60,000 to $61,000 range again. Continued selling could eventually push BTC toward the $53,000 support area, where the lower boundary of the channel currently sits.
FAQs
Subscribe to our YouTube channel for daily crypto updates, market insights, and expert analysis.