Bitcoin Price News: Worst Week Since FTX for BTC, but Crypto Analyst Warns of C‑Wave Lower to $50K

Bitcoin price managed to recover 2.2% today and “protect” the $60,000 support level. It is now trading around $62,000 at press time. Still, the BTC price is down almost 20% this week – one of the worst weeks since the FTX collapse in 2022.
The cleanest explanation is that Bitcoin had fewer new buyers than sellers, so prices fell until leveraged positions were forced out and the decline fed on itself. This looks more like a demand‑driven correction than a structural collapse in the network, since long‑term holders and exchange balances were still relatively firm.
What you'll learn 👉
More Crypto Online: B‑Wave Rally Complete, C‑Wave Lower Ahead
Popular analyst More Crypto Online tweeted a detailed chart analysis (attached). He says Bitcoin has likely completed the typical bear market B‑Wave rally. In many bear markets, the B‑Wave is the phase that convinces people the worst is over. It often produces a strong recovery, improving sentiment, bullish headlines, and renewed confidence. Many participants start believing a new bull market has already begun.
The problem is that B‑Waves are usually corrective in nature. They can be powerful, but they often lack the impulsive structure seen at the start of sustainable bull markets. If the recent rally was indeed a B‑Wave, then the Bitcoin price may now be entering the C‑Wave lower. That would represent the final phase of the bear market, a stage often associated with disappointment, fading optimism, and widespread capitulation.
The analyst highlights what traders should watch:
- A failure to reclaim key resistance levels
- Corrective rallies rather than clear 5‑wave advances
- Increasing bearish momentum after each bounce
- Sentiment shifting from “buy the dip” to frustration and apathy
Ironically, the C‑Wave is often where the best long‑term opportunities are created. The crowd tends to be most optimistic near B‑Wave highs and most pessimistic near C‑Wave lows. Understanding market structure matters more than following sentiment.
Update on Geopolitical Front: President Trump declared that Israeli Prime Minister Netanyahu will have “no choice” but to accept a US deal with Iran, stating bluntly: “I call the shots. I call all the shots. He doesn’t call the shots.” Trump also said that recent Iranian missile strikes will not derail the negotiations and that he believes “the deal is going on.”
This unexpected move toward de‑escalation helped lift Bitcoin above $63,000, as traders reduced their geopolitical risk premium. Reduced fears of a wider war in the Middle East could ease pressure on oil prices and inflation expectations, potentially giving the Federal Reserve more room to consider rate cuts; a positive backdrop for risk assets like Bitcoin.
Bitcoin Chart Analysis
The 1‑day BTC/USD chart shows a clear Elliott Wave structure. The 2025 rally to $120K is labeled as wave (3). The subsequent drop to $60K in early 2026 is wave (4). Then a B‑Wave bounce took price to $82.8K in May 2026. The chart now shows a descending channel with Fibonacci levels.
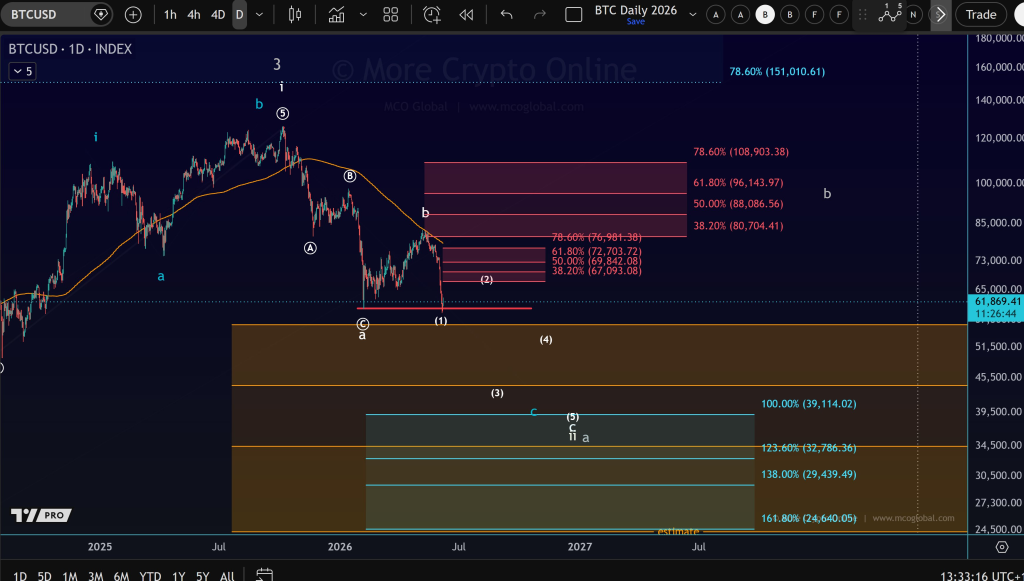
Key support levels are marked at $61,869 (current), $51,500, and $45,500. A deeper target near $39,500 and even $32,786 is shown. The 61.8% and 78.6% retracement levels from the $120K top are around $72‑76K, already broken. The structure suggests that the C‑Wave down could target the $39‑51K region. The chart is bearish in the medium term.
Bitcoin News Today
Bloomberg’s senior macro strategist Mike McGlone forecasts Bitcoin could plunge to $10,000, driven by a macroeconomic “hangover” of high interest rates and tightening financial conditions. He notes Tether (USDT) is poised to overtake Bitcoin’s market cap, having already flipped Ethereum, signaling the market’s foundational shift toward dollar‑based systems.
A wallet containing 47.26 BTC, mined in 2011, became active after 15 years of dormancy. The address is named in the “Noah Doe” lawsuit, which uses New York’s lost‑and‑found statute to claim legal title over 3.7 million BTC across 39,000+ dormant addresses, valued at $293.5 billion. The plaintiffs’ strategy includes sending tiny transactions to these addresses with legal notices.
Germany’s 2024 sale of 49,858 BTC at an average of $57,900 was widely criticized as prices later doubled. However, with Bitcoin now near $62,000 – just 7% above that exit price – the sale appears more prudent. The gap shrank following a 2026 market correction and billions in ETF outflows.
Read also: Crypto Liquidations Hit Hard
Bitcoin Price Predictions Today (June 8)
Below are our Bitcoin price predictions for today, based on current technical structure and market sentiment.
| Scenario | Price Target | Key Condition |
|---|---|---|
| Bullish 🐂 | $63,500 – $65,000 | BTC reclaims $63K and holds above $62K. Short squeeze from oversold RSI could trigger a bounce toward the 50‑day MA near $65K. |
| Bearish 🐻 | $58,000 – $60,000 | $60K support fails. More Crypto Online’s C‑Wave accelerates; next support at $58K then $55K. Continued ETF outflows and macro fear. |
| Likely ⚖️ | $60,000 – $62,500 | Range between $60K and $62.5K. The market is oversold but lacks a catalyst for a strong rally. Expect choppy consolidation with a slight downward bias. |
Overall, Bitcoin recovered to $62K but still posted its worst week since FTX. More Crypto Online argues the B‑Wave rally is complete, and a C‑Wave lower (final bear phase) may be underway. McGlone warns of $10K BTC. A dormant 2011 wallet moved. Germany’s 2024 sale now looks prudent.
The $60K support is critical. If it breaks, the next stop is $55‑58K. If it holds, a relief rally to $65K is possible.
FAQs
Subscribe to our YouTube channel for daily crypto updates, market insights, and expert analysis.