


Bitcoin is having a tough month and is currently trading around $73,500 and poised to close the month with losses of about 3%. The market is now being watched carefully by investors for any chance of a recovery that will help the market hold on to an important level.
There are several reasons behind this. ETFs experienced major inflows, futures markets are flooded with leveraged positions, and there is talk that another purchase of strategy will take place soon.
What you'll learn 👉
Factors Driving the BTC Price Right Now
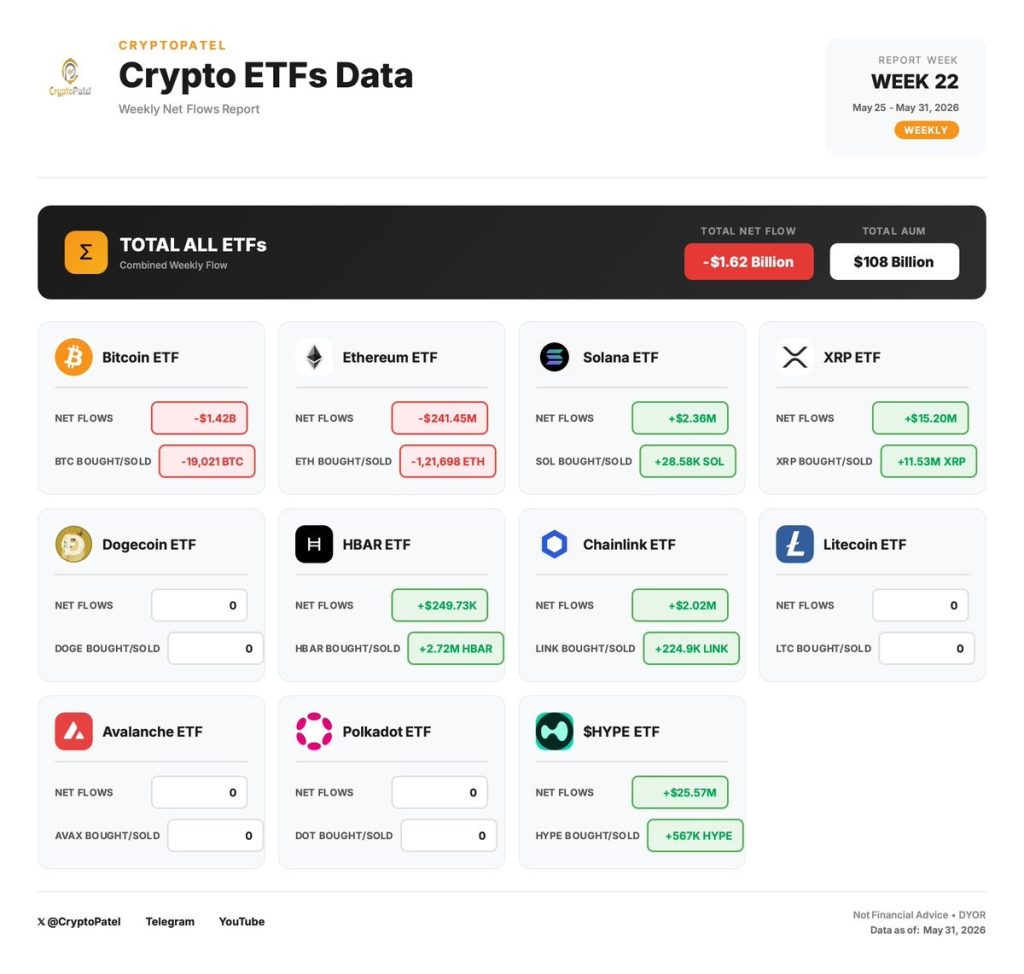
One of the biggest stories affecting the BTC price comes from the ETF market. Data shared by Crypto Patel shows that US spot Bitcoin ETFs recorded approximately $1.42 billion in net outflows between May 25 and May 29.
Over that period, ETF providers collectively sold around 19,021 BTC. To put that into perspective, that amount represents roughly 42 days of newly mined Bitcoin supply. BlackRock led the outflows with about 12,757 BTC sold. Grayscale reduced holdings by around 2,741 BTC, Fidelity sold approximately 2,232 BTC, and other issuers also recorded net selling.
When institutions pull that much Bitcoin out of ETFs in a single week, it naturally raises concerns about near-term demand. While this happens, there is already talk that June might be a volatile month for the derivatives market.
The open interest for bitcoin futures contracts now stands at approximately $42.6 billion, with about $8.5 billion in options contracts that will expire on June 26. The estimated “max pain” range for these contracts lies within the $77,500 to $78,000 level.
Read Also: Charles Hoskinson’s Wild Bitcoin Price Prediction: $1.5M or $3M per Coin – Here’s the Math
Here’s What the BTC Chart Is Showing
We had a look at the MVRV Pricing Bands chart shared by Ali Martinez, and one level immediately stands out: $72,648. The MVRV framework examines the relationship between the market value and the realized value of bitcoin, which refers to the average cost at which coins were last transacted.
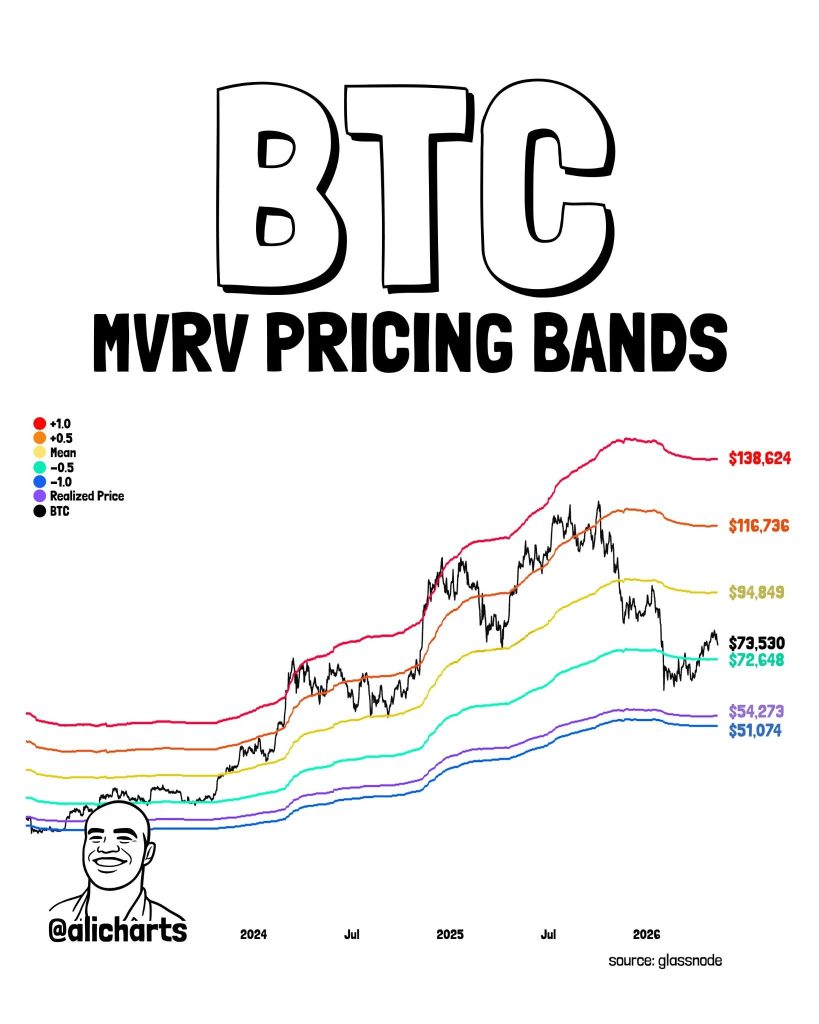
As of now, the BTC price stands at approximately $73,530, representing only a 1.2% rise from the -0.5 sigma band of $72,648. In the past, this level has been a significant support region that offered favorable reward-risk dynamics for buyers.
That explains why Ali Martinez is paying such close attention to this level. If Bitcoin continues holding above it, the market may view the recent weakness as a normal correction within a larger cycle.
The next major support sits much lower. If $72,648 breaks, the MVRV model points to a demand zone between $54,300 and $51,000. Those levels line up closely with Bitcoin’s realized price of $54,273 and the -1.0 standard deviation band near $51,074. Looking upward, the MVRV mean band sits at $94,849. That’s considered the model’s fair-value level and represents nearly 29% upside from current prices.
The asymmetric fit on Bitcoin upper and lower tails back in 2020 does not include the 2021 data (obviously). It thus makes the upper tail too optimistic. By adding the 2021 data it aggressively pulls down the upper tail. https://t.co/MHwvbIDKsM
— Benjamin Cowen (@benjamincowen) May 30, 2026
Another long-term perspective comes from Benjamin Cowen’s logarithmic regression model. His analysis shows Bitcoin continuing to trade within its historical growth channel despite the correction from six-figure highs. The model also shows that each cycle tends to produce smaller percentage gains than the one before, a pattern that has persisted for more than a decade.
Where Could the BTC Price Go Next?
The answer depends largely on what happens around $72,650. If the BTC price holds above this level, the first major target remains the MVRV mean near $94,849. That would put Bitcoin back into its historical fair-value range and potentially restore confidence after a difficult month.
There is also support from derivatives positioning. With options markets heavily concentrated around the $77,500-$78,000 area, traders could see upward pressure develop if Bitcoin begins moving higher into June.
The bearish case becomes much stronger if support fails. A decisive break below $72,650 would put the focus on the next major demand zone between $54,300 and $51,000. That would represent a decline of roughly 26% to 30% from current levels and bring Bitcoin closer to the average cost basis of long-term holders. The next few weeks could play a major role in determining where the BTC price heads for the rest of 2026.
FAQs
Subscribe to our YouTube channel for daily crypto updates, market insights, and expert analysis.






