A day has gone by after the latest ETF rejection and the price didn’t dump as much as it was expected. Most of the sell pressure got absorbed and we managed to stay inside the $6000-$6600 range. Strangely enough just hours after confirming the ETF rejection, the SEC announced they will be reviewing the rejected applications once again. This move definitely doesn’t make them look good, especially considering how much they criticized cryptocurrency markets for manipulation in the past. Still, for now not much has changed as BTC keeps ranging, of which alts took advantage and slightly recovered. Let’s take a look at what some TA experts reported:
Bitcoin (BTC)
As always, we saw a diverse cast of opinions regarding Bitcoin and its movements. LanaFL offered a rather bearish outlook, at least for the short term:
“As you can see, RSI currently ~50 remaining neutral for move in both ways, but BTC 0.24% painted a big bearish flag which means that discounts are coming soon. Up to how far it will go, we can break the neckline oh the H&S that I discussed previously, and it may lead to not just discounts, but the real Black Friday (The target of inverse this H&S is 3700). The area between 6050 and 7150 is a real no-trade zone (NO-NO!)”
Turningmecard noticed that Bitcoin started showing some signs of strength after a period of boring consolidation. He does feel we will be revisiting bottom levels more before we manage to break out of the range:
“So 1hour chart has a thick ichimoku cloud in front of BTC. Normally in downtrends, BTC will retrace a bit, maybe to 64 levels at the most. However it can just soar up to 67 zone from 64.7~8 from now, that is also highly possible, who knows. But usually BTC cannot stand the confluence. Also, there are some bear divergence on volume and RSI frames, so i guess BTC could drop to the bottom of the wedge, around 6400 and try its journey again.”
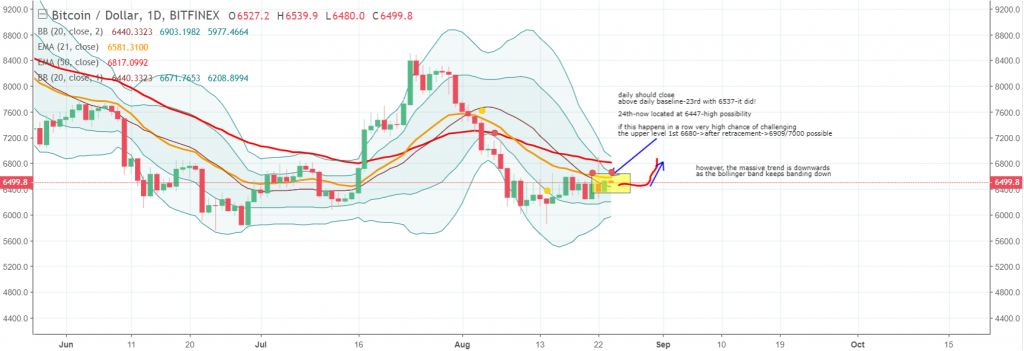
As always, he offers a much deeper insight into the technical picture, including the analysis of the Bollinger band and a comparison of shorts/longs.
“Short positions are way too high! That means in mid/long term we are still in a downtrend, but, squeeze is definitely needed! I think that is why 62/63 level is so well defended, and this upward/downward movement seems like it will never end. So this will end when BTC finally retests high level. So, after a small retracement, or maybe big, it should retest up levels. “
You can check out his complete analysis here for additional insight into his entry/exit/stop loss zones. Another bullish view was presented by alanmasters, who acknowledged the shorts being at an ATH level and decided to look at the long term picture:
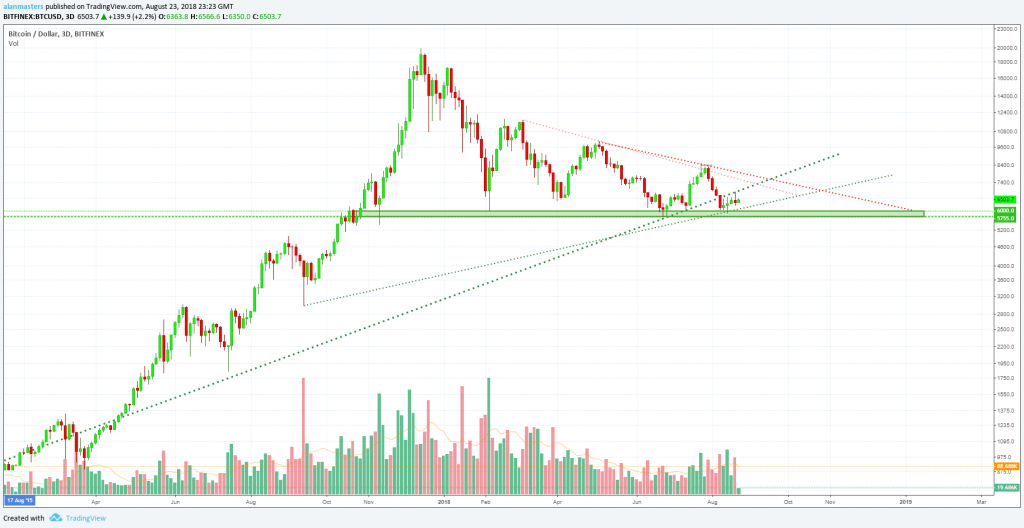
“I believe we will continue to trade within the triangle (red dotted line and green square) until Bitcoin 0.35% finally breakout, up, and starts a new strong uptrend. The last drop can take us out of the triangle but we wouldn’t last long there. If Bitcoin is to drop strong it should bounce back up quickly… When looking at the bullish scenario long term. On the bearish side, I can see Bitcoin going lower, having a failed run up to finally keep on crashing, which can continue until around February when inevitably the next up run will start. This scenario is less likely in my opinion but obviously still very possible.
Regardless what happens to Bitcoin in the short term, we have great potential and expectations for the long term.”
He also explains why he sees $5000 as a very strong support; check out his complete insight here. Finally we found a little piece of wisdom on Twitter as well, with user XCBitcoin noticing a rounded bottom pattern forming on the chart:
$BTC 2018 Rounded Bottom pic.twitter.com/e5ouDTVJzW
— XC (@XCBitcoin) August 24, 2018
Ethereum (ETH)
TheChartGuys feel that a short term move is imminent for the biggest altcoin on the market:
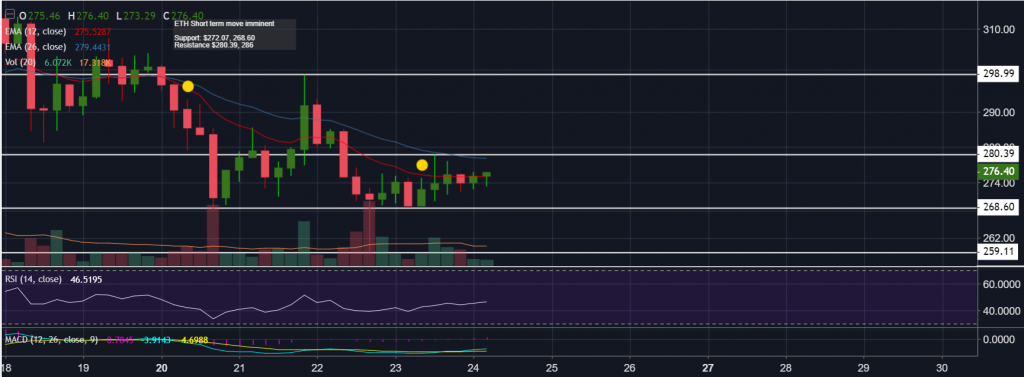
“ETH clearly remains weaker than BTC with the beats still in control of the ETHBTC chart.
We are currently essentially forming a handful of 4 hour inside bars in a row, on declining volume. We will see a volume spike and a break in these tightening patterns this morning, but I will not look for much follow through unless BTC volatility picks up as well.
I personally would continue to look to BTC for bullish plays and ETH if we see BTC bearish, as that correlation would have that strategy seeing bigger gains for the most part over a large sample size and longer term time frames.
ETH bears have a bit of comfort where it would be likely for BTC to see clear bull breaks, before ETH bulls followed along, due to the weaker positioning on the daily chart.”
Ripple (XRP)
Trader easyMarkets feels XRP could be in for a bounce:
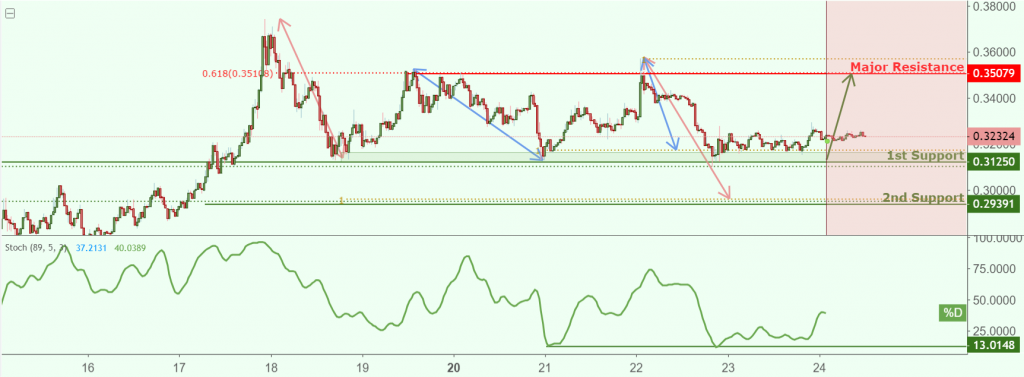
“XRPUSD is approaching our first support at 0.3125 (horizontal overlap support, 100% Fibonacci extension, 50% Fibonacci retracement) where a strong bounce might occur above this level pushing price up to our major resistance at 0.3507 (horizontal swing high resistance, 100% Fibonacci extension, 61.8% Fibonacci retracement). Stochastic (89,5,3) is also approaching support where a bounce off this level might see a corresponding rise in price.”
Bitcoin Cash (BCH)
Basil13 thinks BCH is in for some “Bcashtastic” times:
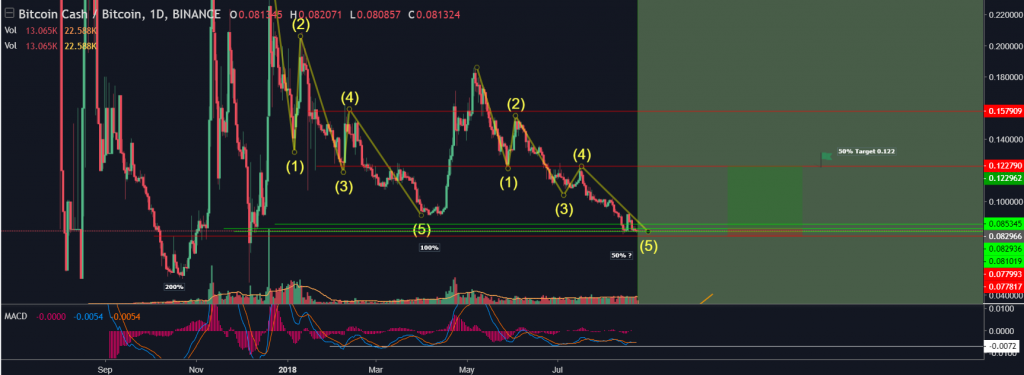
“Evident 5 waves down if you compare this downside move to the previous one; hard to pick a good entry but i have based it on the wave and fractal. Noticed an interesting percentage correlation highlighted in the text boxes, also the MACD indicator is respecting a lower boundary. Aiming for 50% on the upside from here marked on the chart with a green flag, it may fall through which is why risk management is no.1 in any area of trading.”
EOS (EOS)
Trader beelao indicates how EOS could be on the move soon:
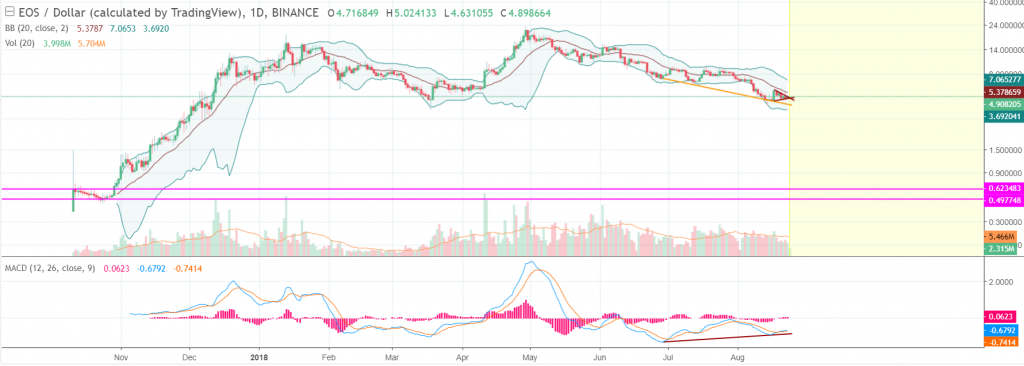
“Looks like EOS might be on the same move as LTC. On the day chart, we see that a wedge is forming. It can either go up or down (orange). Now if we look to the MACD, we see that there already has been a divergence. It may or may not continue. The choice is up to you. But for me, I say I would wait to see a confirmation of an uptrend. Until then, keeping my money where it is.“
He claims EOS still needs a lot of correction before it hits its bottom.
Other thoughts
The range we are currently in has been fairly kind for altcoins, as they have slightly recovered over the last couple of weeks. Theta (34%), NEO Gas (27%) and Nano (22%) have been the top gainers in the last day, while Bitcoin Diamond, Aurora and Cortex recorded losses of 5% respectively. @TheCryptoDog noticed an Adam & Eve pattern forming on the joint alts chart:
Higher time frame Adam & Eve set up developing on $ALTS. Let's see if it plays out.https://t.co/h4h1vQyJOP pic.twitter.com/ltoT2lqtTe
— The Crypto Dog? (@TheCryptoDog) August 23, 2018
He further added:
“If we break the overhead resistance, I expect a strong market wide recovery for $ALTS, roughly 45% increase in value from current price to the next major resistance.”
For now, we wait for the move out of the $6000-$6600; the daily close above $6500 should be a bullish sign. Further developments on the shorts/longs discrepancy will be worth keeping an eye on as well.