XRP price had a pretty solid week. The token recovered around 8% and is now trading near $1.13. On July 4, XRP led the day’s majors with a 5.3% surge to $1.18, briefly surpassing USDC to become the fifth-largest cryptocurrency by market value at roughly $73 billion.
The broader crypto market is showing signs of life. Bitcoin reclaimed $63,000, Ethereum pushed above $1,800, and altcoins are bouncing across the board.
But analyst Celal Kucuker, who has covered XRP for years, posted an interesting tweet that I believe will be useful for our readers.
What you'll learn 👉
Kucuker’s XRP/BTC Thesis
Celal Kucuker is a financial analyst with over 20 years of market experience. He has been consistently bullish on XRP’s long-term outlook, previously projecting that XRP price could reach $10 between December 2026 and February 2027. He also believes XRP is positioned to outperform Bitcoin significantly.
His latest tweet is even more specific.
Kucuker wrote:
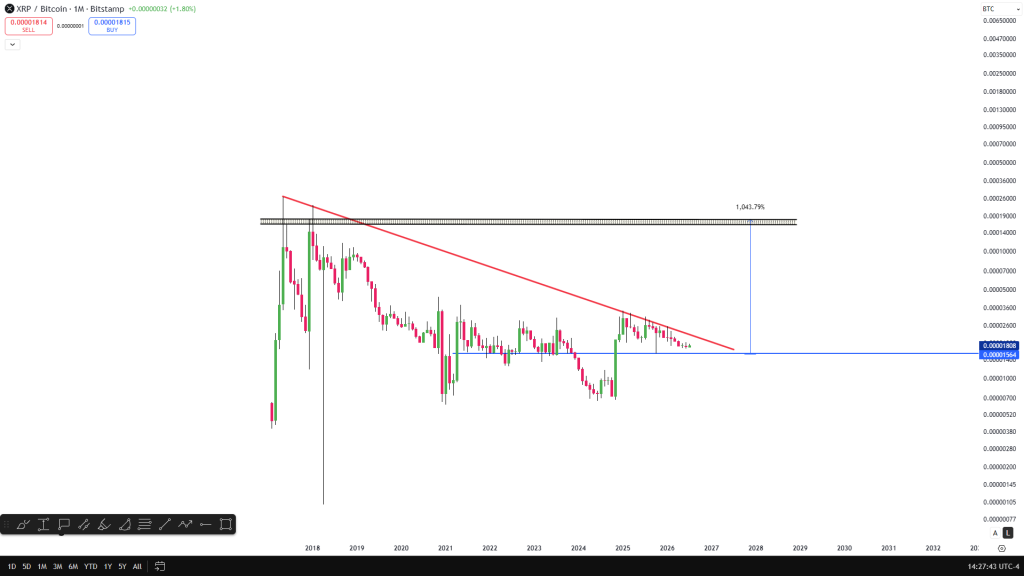
“The XRP/BTC chart is approaching a major moment. The red descending channel is close to breaking. When that breakout happens, I expect Ripple to outperform Bitcoin by 10x from here. By the time BTC is printing new ATH, XRP will likely already be trading above $12. Save this tweet. Come back to it later.”
The XRP Chart: A Descending Channel Since 2021
The chart Kucuker attached shows the XRP/BTC monthly pair on Bitstamp from roughly 2015 to 2026. The key feature is a red descending channel that has contained XRP’s price action against Bitcoin for over four years.
What the chart shows:
- The descending channel: XRP/BTC has been making lower highs and lower lows within this channel since the 2021 peak near 0.00003200 BTC. Each attempt to break higher has been rejected, pushing the pair back toward the lower boundary.
- The breakout point: The pair is now approaching the upper boundary of this channel. Kucuker believes this is the moment of truth. A breakout above the red trendline would signal that XRP is finally gaining strength against Bitcoin.
- The 1,043% annotation: The chart shows a massive projected move labeled 1,043.79%. This aligns with Kucuker’s 10x outperformance thesis. From current XRP/BTC levels, that target would represent a gain of roughly 1,350%.
- Historical context: The descending resistance line represents the most important barrier on the XRP/BTC chart. A confirmed breakout above this trendline could shift momentum sharply in XRP’s favor. The lower boundary of the channel has been tested multiple times and held, suggesting the downtrend is losing steam.
- Volume profile: The XRP chart covers a multi-year period with declining volume in the downtrend, which often precedes a trend reversal. A breakout with strong volume would confirm the move.
What this means: The XRP/BTC pair has been in a structural downtrend for years. Kucuker is arguing that this downtrend is about to end. When it does, XRP will not just rise against the dollar – it will rise faster than Bitcoin.
Read also: Claude AI Predicts XRP Price by the End of August 2026
XRP ETFs See Eighth Consecutive Week of Inflows
While Kucuker’s chart is technical, the fundamentals are also improving.
XRP spot ETFs saw $6.55 million in net inflows on July 2, marking an eighth consecutive positive week. June recorded $59.46 million in net inflows, and July has started on a positive note with $4.68 million month-to-date.
Cumulative XRP ETF inflows now stand at $1.49 billion, up from $1.43 billion on June 1. Total assets under management average roughly $988 million.
The inflows coincide with critical progress for the U.S. CLARITY Act, a market structure bill that would provide regulatory clarity for digital assets. On Polymarket, the odds of the CLARITY Act being signed into law in 2026 have climbed to 42% , up from below 40% only days earlier. A higher probability of the bill’s passage could provide a significant tailwind for XRP given its regulatory clarity compared to other assets.
Where Could XRP Price Go From Here?
Kucuker’s $12 target is a long-term projection. But what about the short term XRP price action?
Bullish scenario: If XRP/BTC breaks above the descending channel, momentum could accelerate quickly. The immediate resistance on the USD pair is $1.20, then $1.30. A clean break above $1.18 would confirm the recovery. From there, the path to $1.50 opens up, especially with ETF inflows and positive regulatory momentum.
Neutral scenario: XRP consolidates between $1.05 and $1.20. The ETF inflows provide support, but the broader market remains cautious. A period of range-bound trading would allow the price to build a base before the next leg higher. This would be a healthy consolidation after the recent recovery.
Bearish scenario: A rejection at the descending channel resistance could send XRP/BTC back toward the lower boundary. On the USD pair, support sits at $1.05, then $1.00. A break below $1.00 would invalidate the bullish thesis and could trigger a move back toward the $0.90‑$0.95 zone.
Overall, Kucuker’s XRP/BTC chart is interesting. The descending channel has contained XRP’s relative performance for years. A breakout would be a significant technical event. The ETF inflows and improving regulatory outlook provide fundamental support.
But the breakout is not confirmed yet. The chart is “close to breaking,” not “broken.” Traders should watch for a clean break above the descending resistance line on the monthly timeframe. That would be the signal that Kucuker’s $12 target is coming into play.
Subscribe to our YouTube channel for daily crypto updates, market insights, and expert analysis.